

基于beiwei VG200存储数据的可视化处理【MATLAB】
迪丽瓦拉
2025-06-01 03:43:14
0次
基于beiwei VG200存储数据的可视化处理【MATLAB】
作者:PEZHANG
时间:2023.3.21
数据载体:txt文本(beiwei VG200,UTF-8编码)
数据可视化软件:MATLAB 2021a(Windows version)
针对北微传感器导出的txt文本数据,写了数据可视化代码,供参考。上位机可以导出实时三轴和实时九轴的数据,数据特点如下图所示。
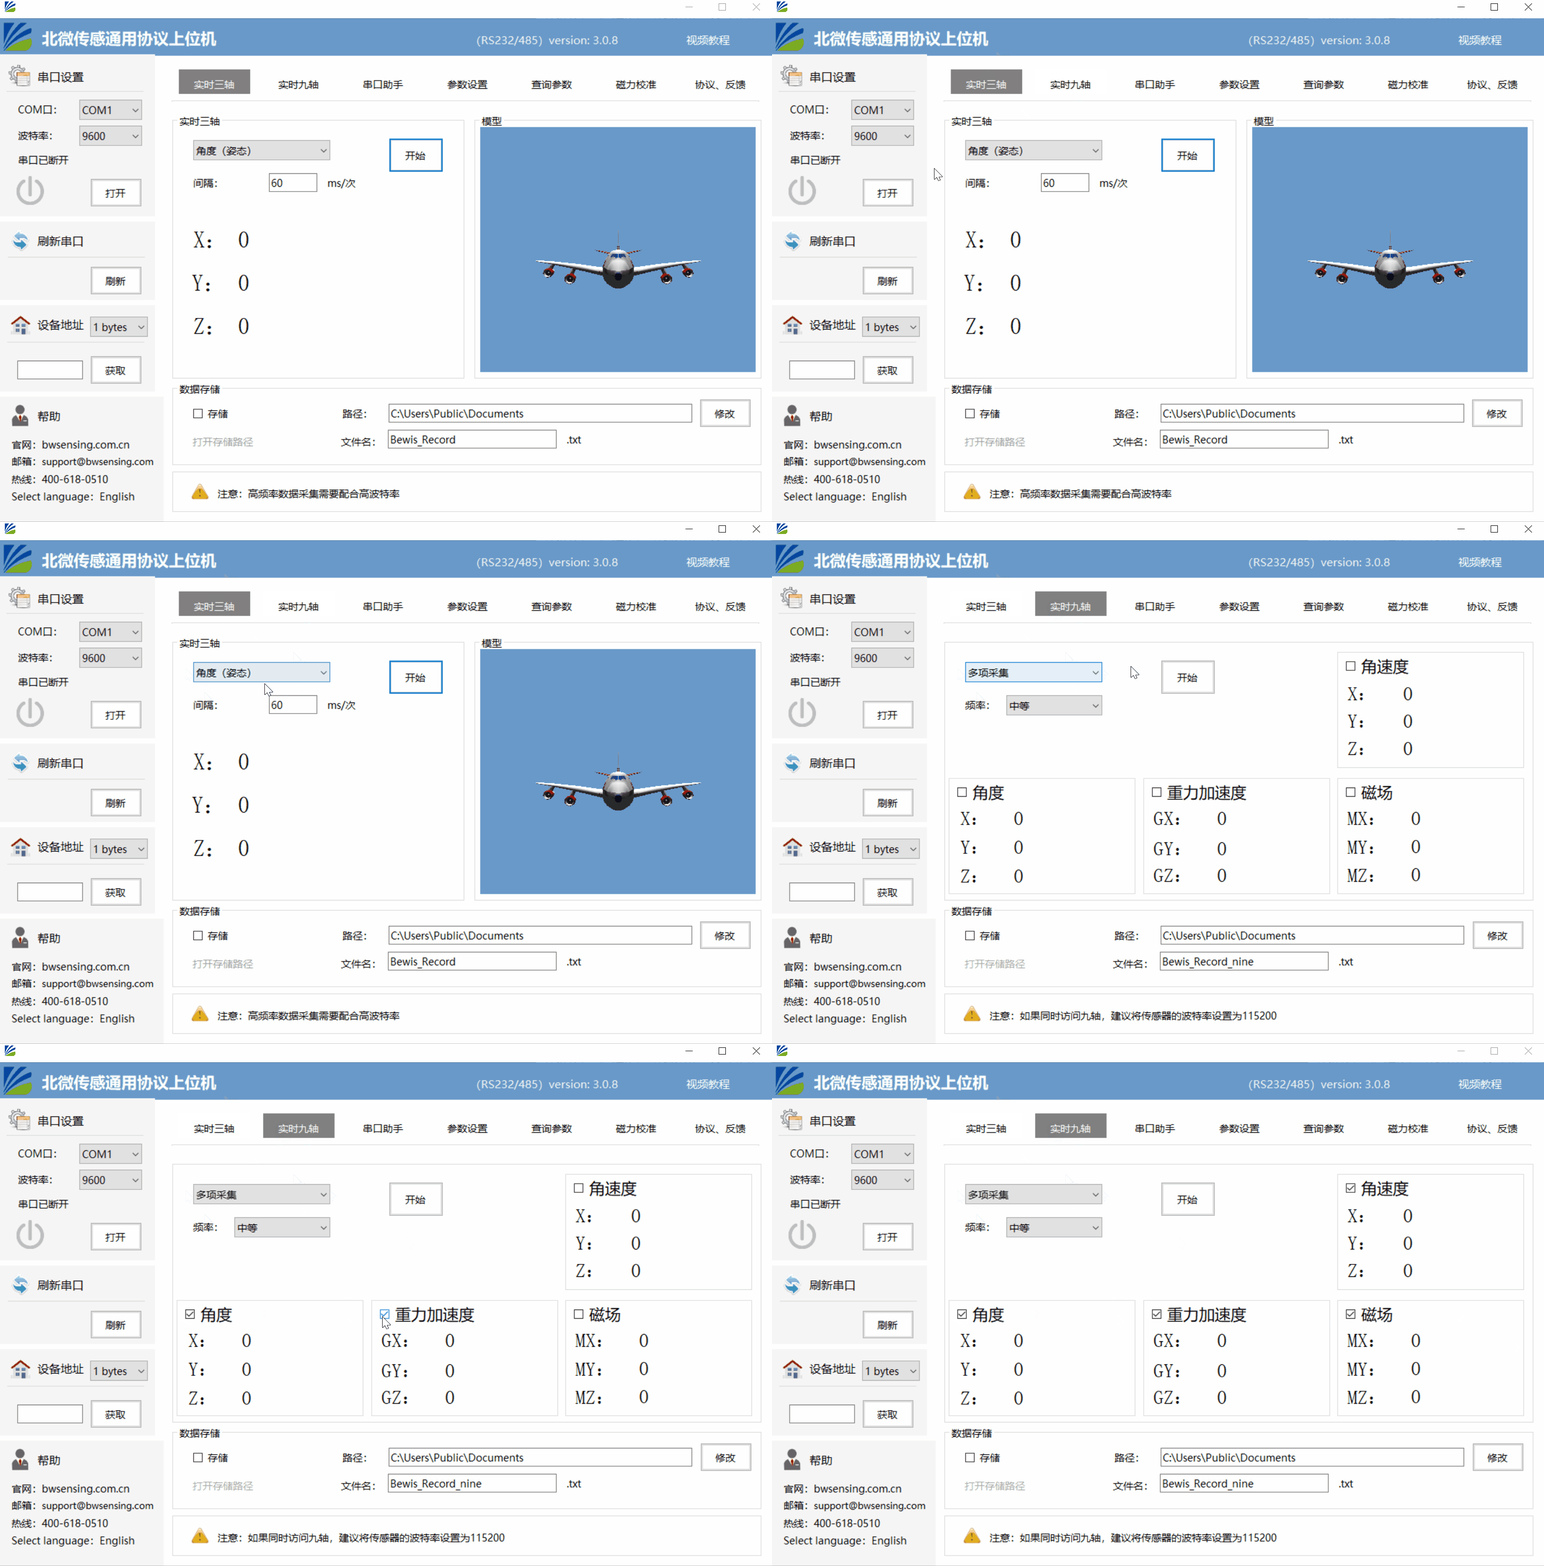
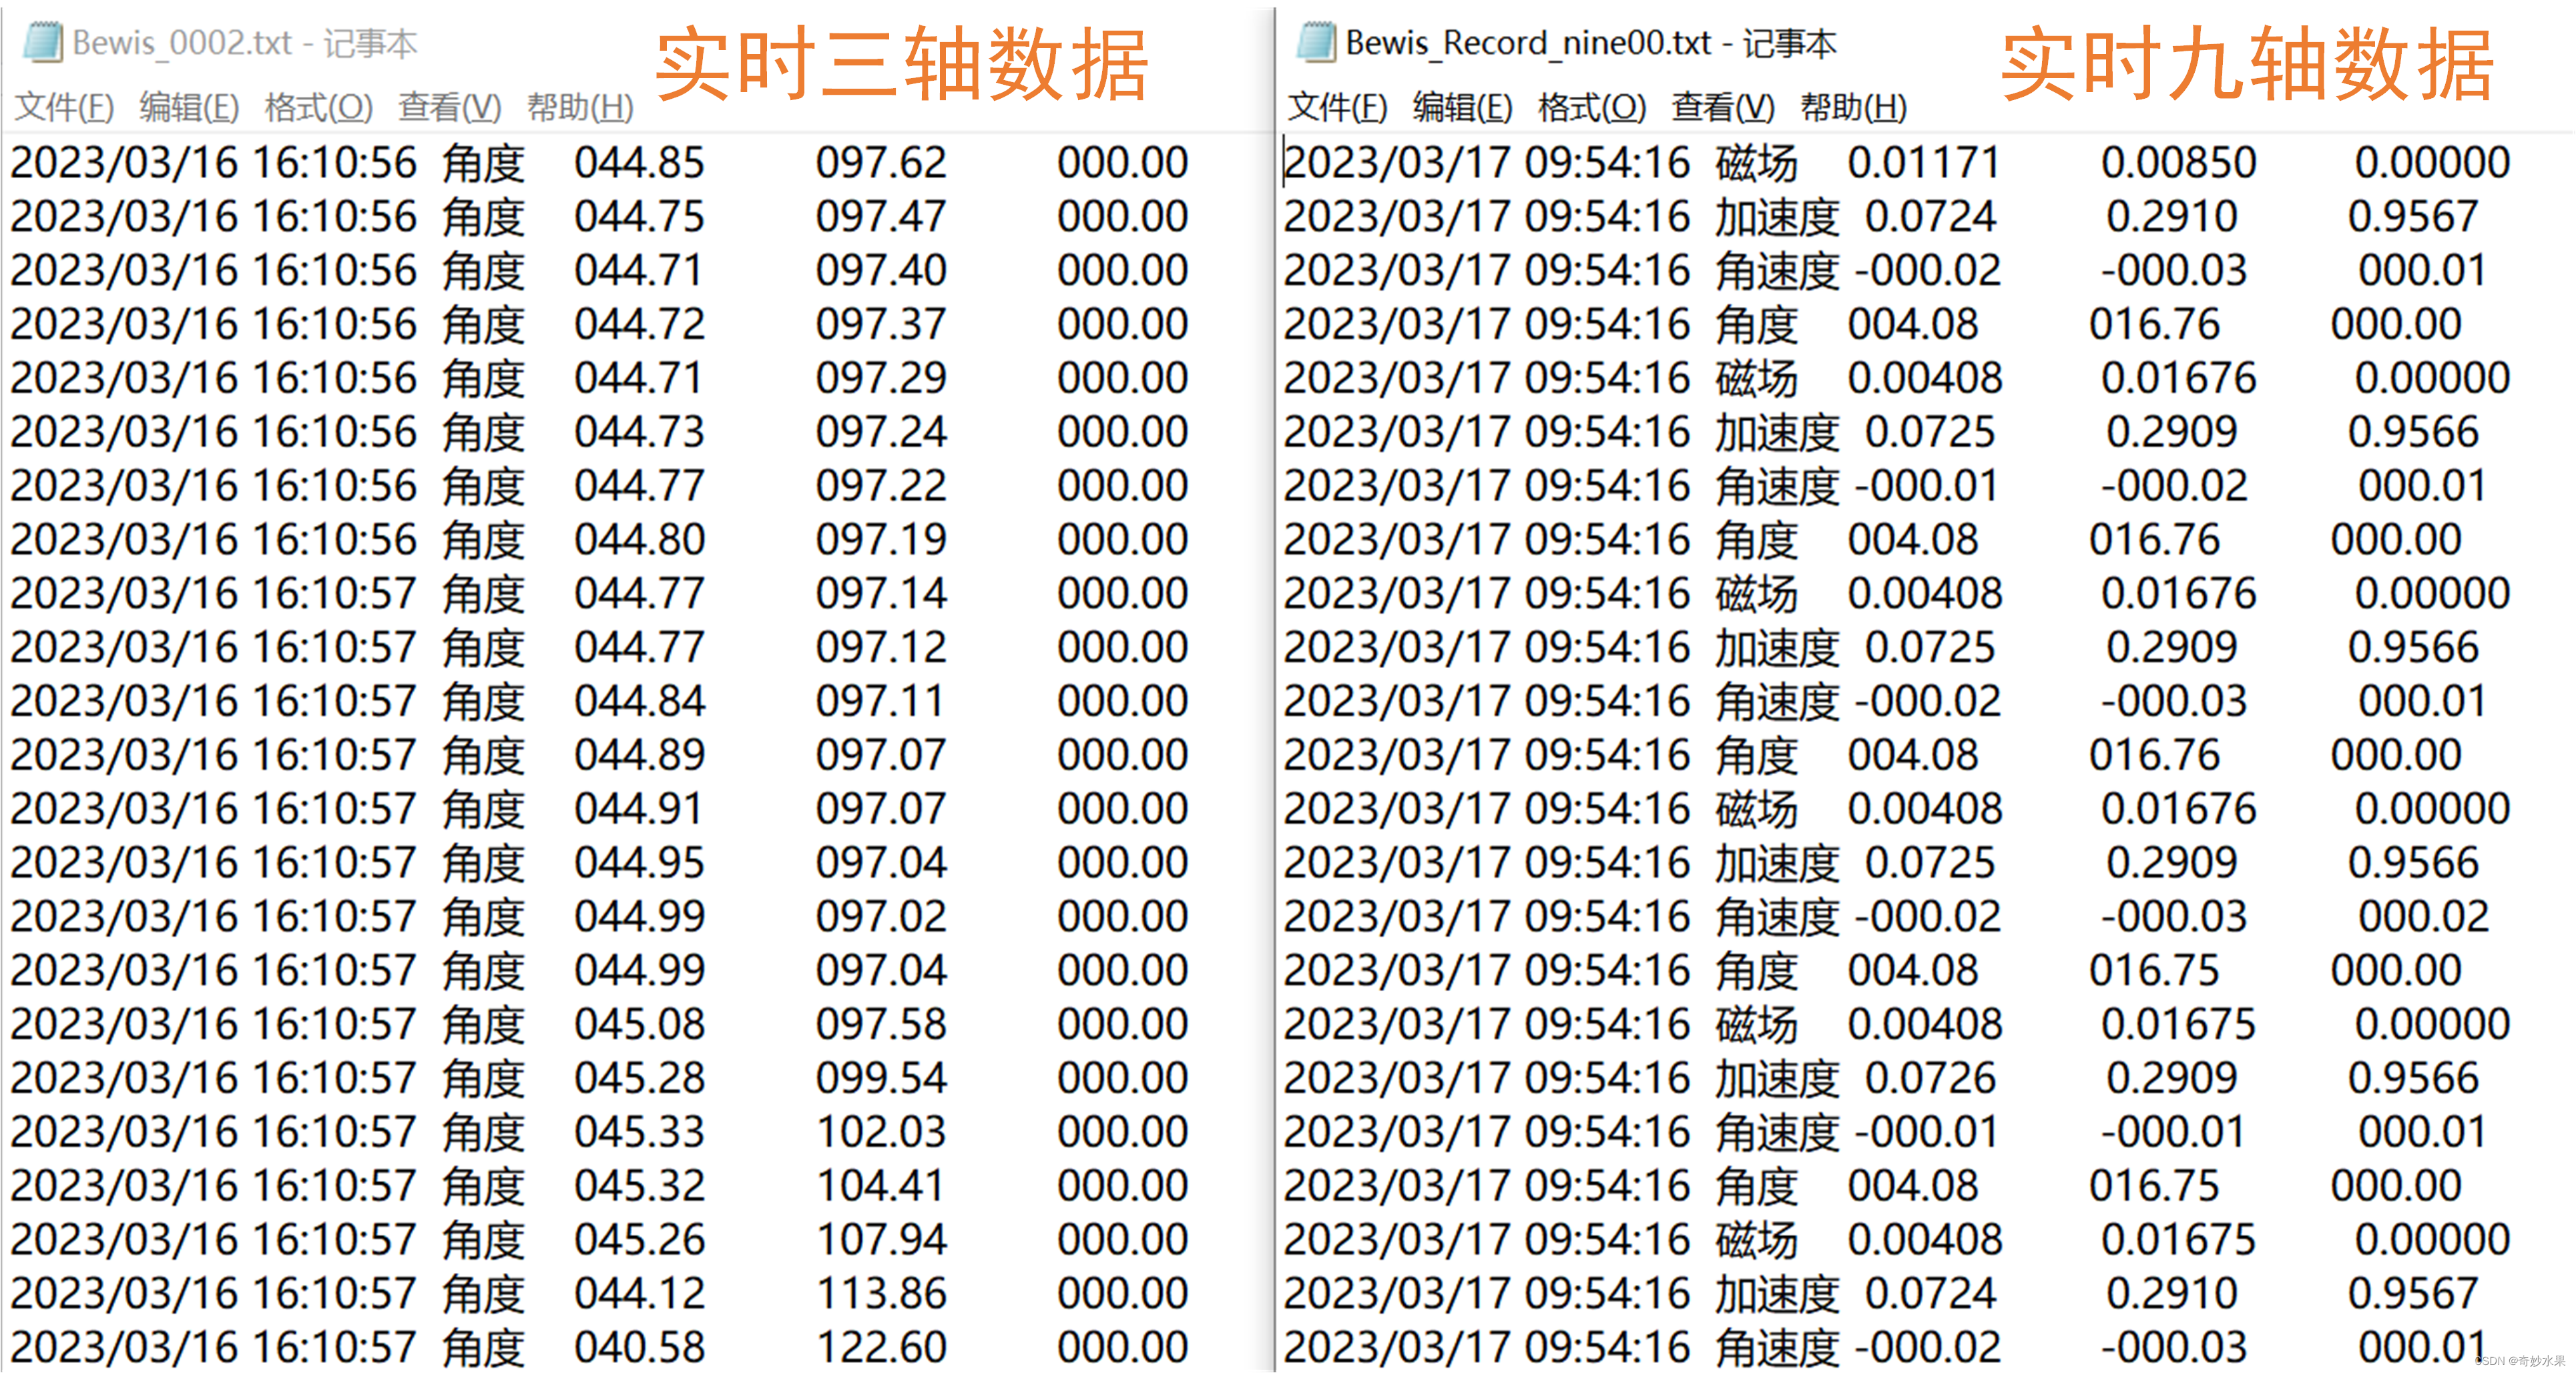
适用于实时三轴数据的源代码及处理结果图
此部分的代码延续了之前的MATLAB制图风格。
源代码
clear;clc;
close allfilename = 'Bewis_0002.txt';
delimiterIn = ' ';
headerlinesIn = 0;
A = importdata(filename,delimiterIn,headerlinesIn);% generate x data
Ts = 0.06;
[m,n] = size(A.data(:,1));
t = (1:m)*Ts;% figure
% plot(t,A.data(:,1),'Displayname','pitch theta')linewidth = 1;
wordsize = 12;% figure('Color','white')
figure
set(gcf,'unit','centimeters','position',[20 10 15 7])
plot(t,A.data(:,1),'Displayname','pitch theta')
set(gcf,'unit','centimeters','position',[20 10 15 7])
xlabel('Time (s)','FontSize',wordsize);
ylabel('Theta (°)','FontSize',wordsize);
ax = gca;
ax.YGrid = 'on';
set(gcf,'color','w')
legend
print('-dpng','-r600','x角度')figure
set(gcf,'unit','centimeters','position',[20 10 15 7])
plot(t,A.data(:,2),'Displayname','roll theta')
set(gcf,'unit','centimeters','position',[20 10 15 7])
xlabel('Time (s)','FontSize',wordsize);
ylabel('Theta (°)','FontSize',wordsize);
set(gcf,'color','w')
ax = gca;
ax.YGrid = 'on';
legend
% print('-painters','-djpeg','-r300','角度')
print('-dpng','-r600','y角度')
% print('-painters','-dpdf','角度')
运行结果
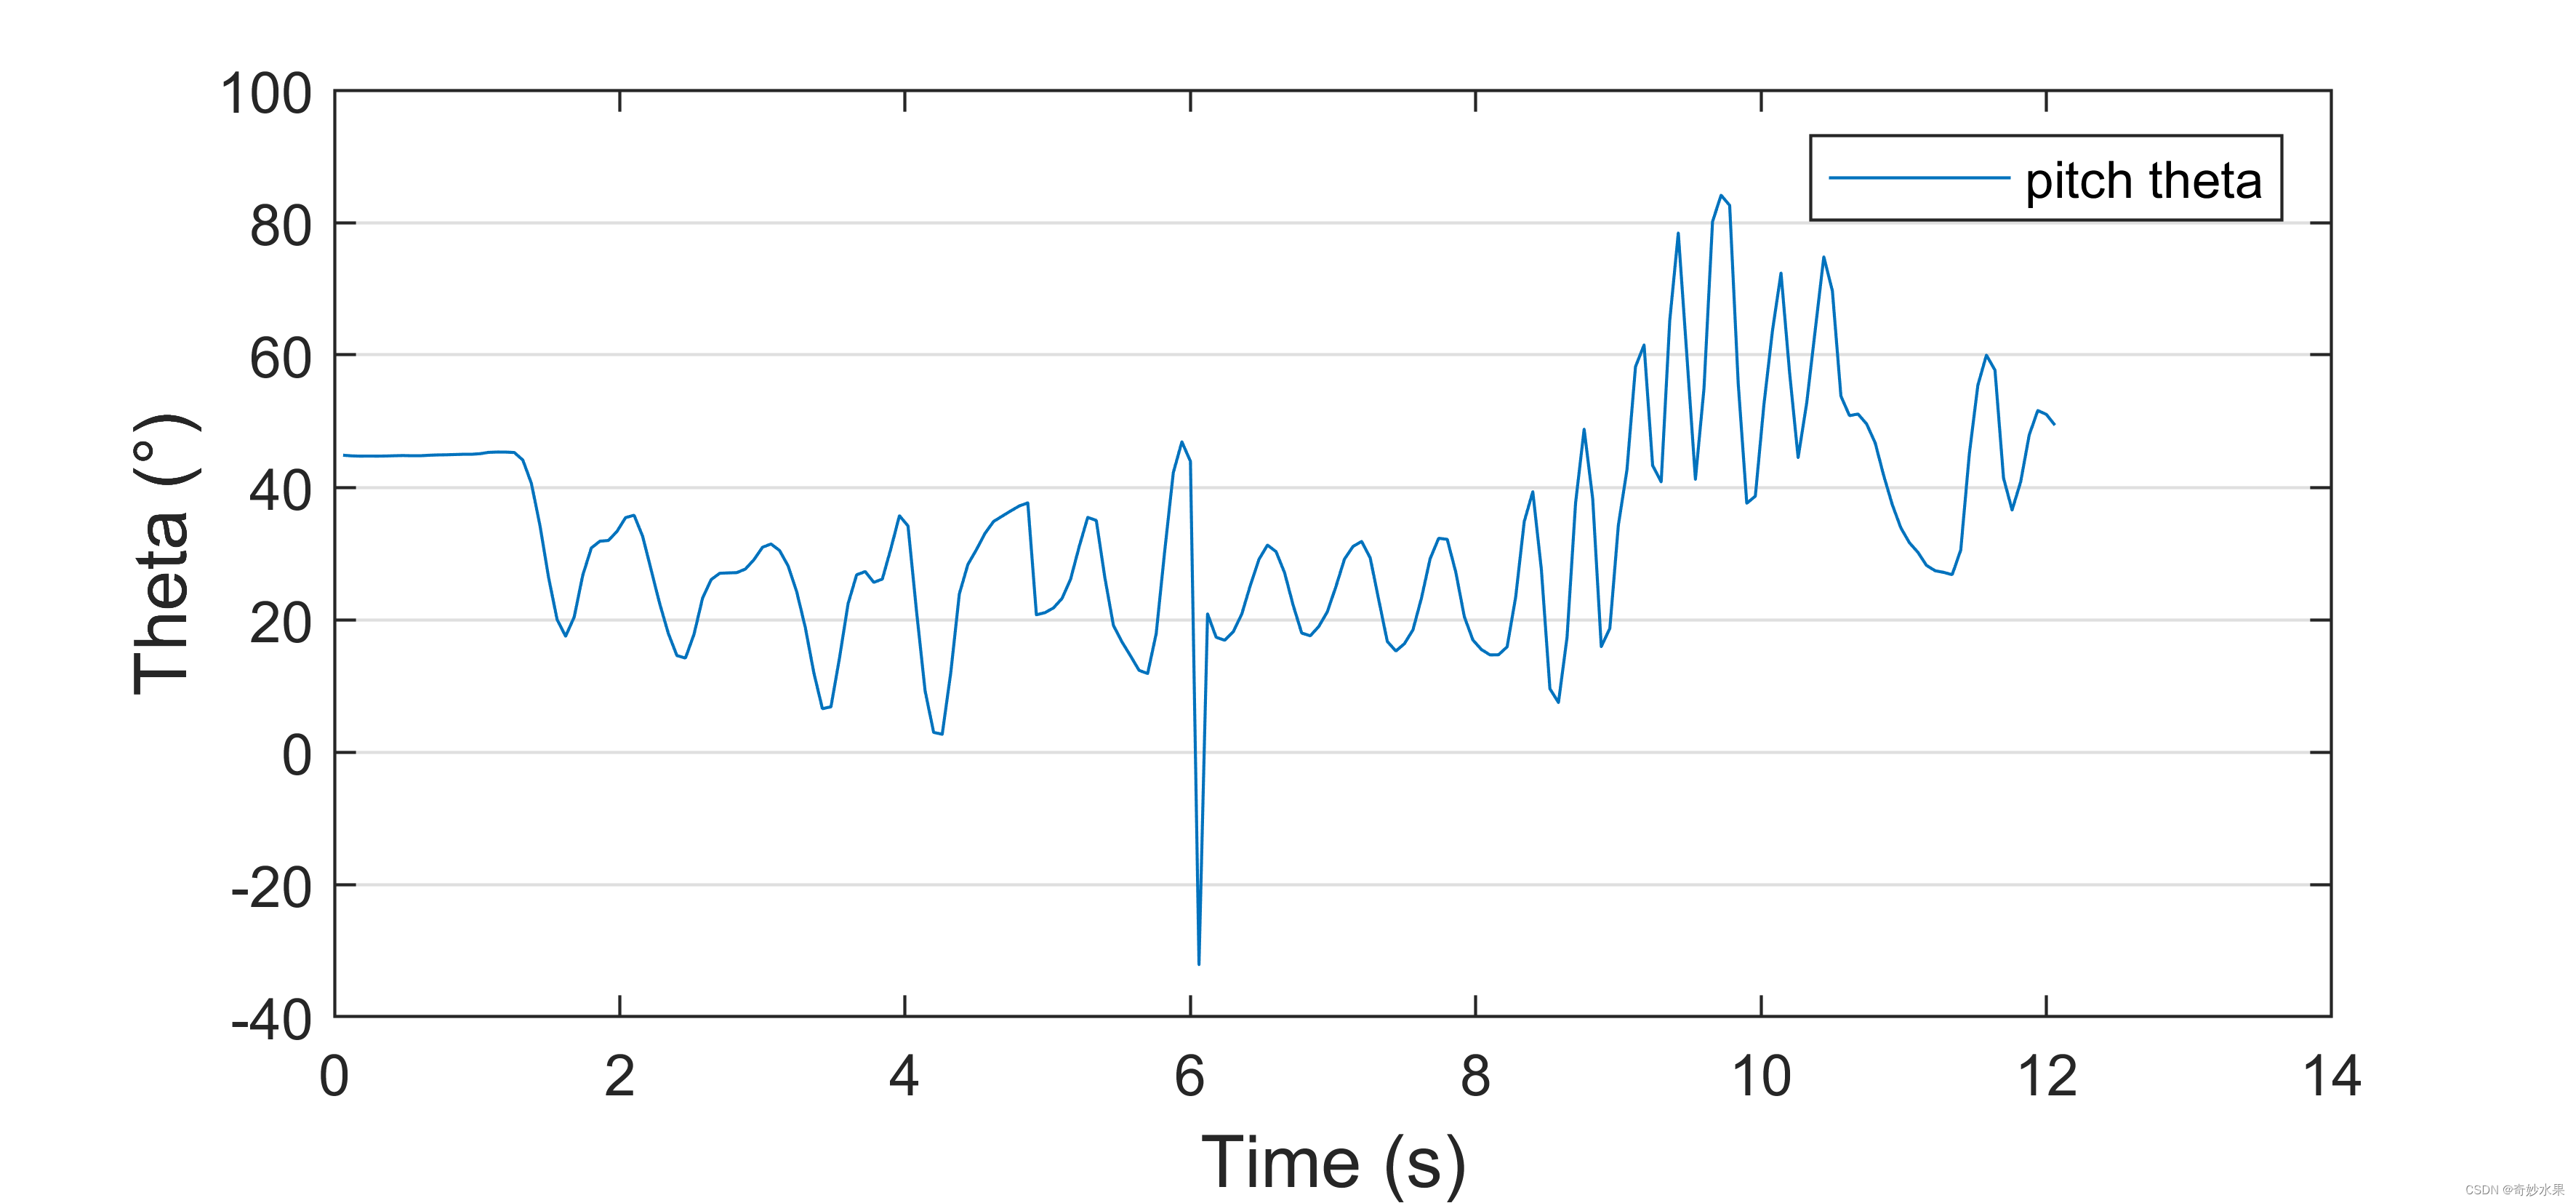
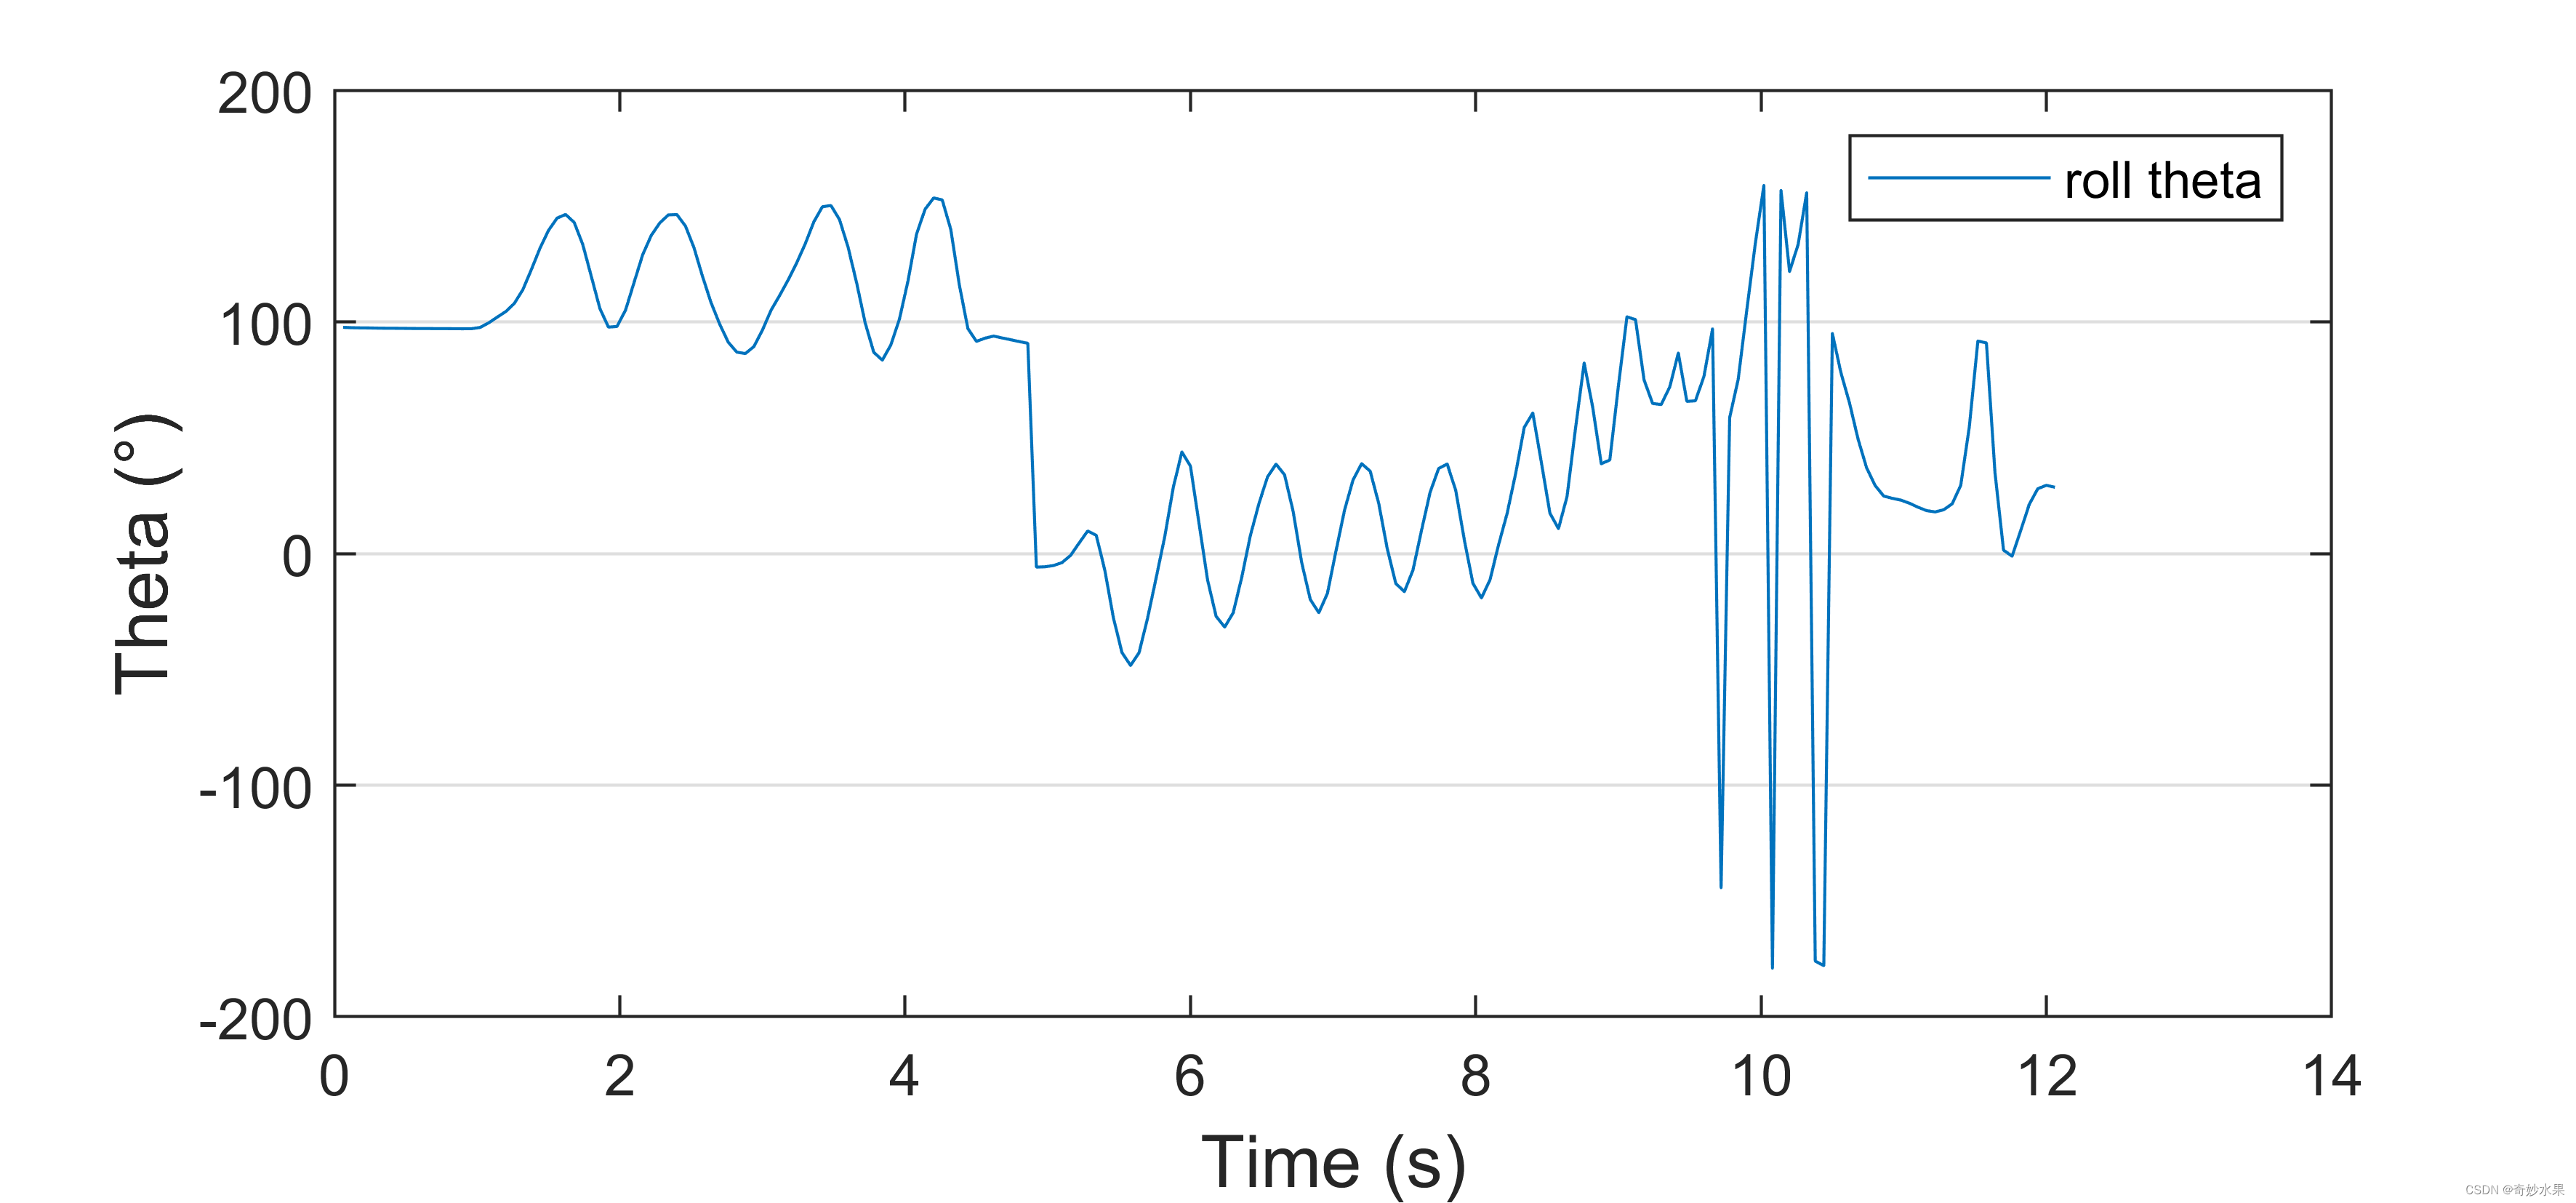
在此文代码探索过程中,对MATLAB制图代码的风格做了调整,在改进代码中,全部以句柄的形式对图片的格式进行控制,这一点增强了代码的普适性和一致性,在前文的代码中,是可以看出,句柄函数和非句柄函数是共存的。
改进代码
源代码
clear;clc;
close allfilename = 'Bewis_0002.txt';
delimiterIn = ' ';
headerlinesIn = 0;
A = importdata(filename,delimiterIn,headerlinesIn);% generate x data
Ts = 0.06;
[m,n] = size(A.data(:,1));
t = (1:m)*Ts;% figure('Color','white')
% set(gcf,'color','w')% tiledlayout(2,1)
tiledlayout(2,1,'TileSpacing','compact')
h = gcf;
h.Color = 'w';
h.Units = 'centimeters';
h.Position = [25 10 15 11];
% h.position = [20 10 15 7];ax1 = nexttile;
plot(ax1,t,A.data(:,1),'Displayname','pitch theta')
% set the style of ax1
ax1.FontName = 'times new roman';
ax1.FontSize = 12;
ax1.YLabel.String = 'Theta (°)';
% ax1.LabelFontSizeMultiplier = 0.9;
% legend('FontSize',12)
legend
% legend(ax1,{'Line 1'})
% ax1.Legend.TextColor = 'red';
ax1.YGrid = 'on';
ax1.GridLineStyle = '--';ax2 = nexttile;
plot(ax2,t,A.data(:,2),'Displayname','roll theta')% set the style of ax2
ax2.FontName = 'times new roman';
ax2.FontSize = 12;
% yline(0,'--')
ax2.YGrid = 'on';
ax2.GridLineStyle = '--';
ax2.XLabel.String = 'Time (s)';
ax2.YLabel.String = 'Theta (°)';
% legend(ax2,{'Line 1'})
% ax2.Legend
legend% export figure
% print('-djpeg','-r300','角度')
print('-dpng','-r600','角度')
% print('-painters','-dpdf','角度')
% print('-painters','-dmeta','角度')
运行结果图
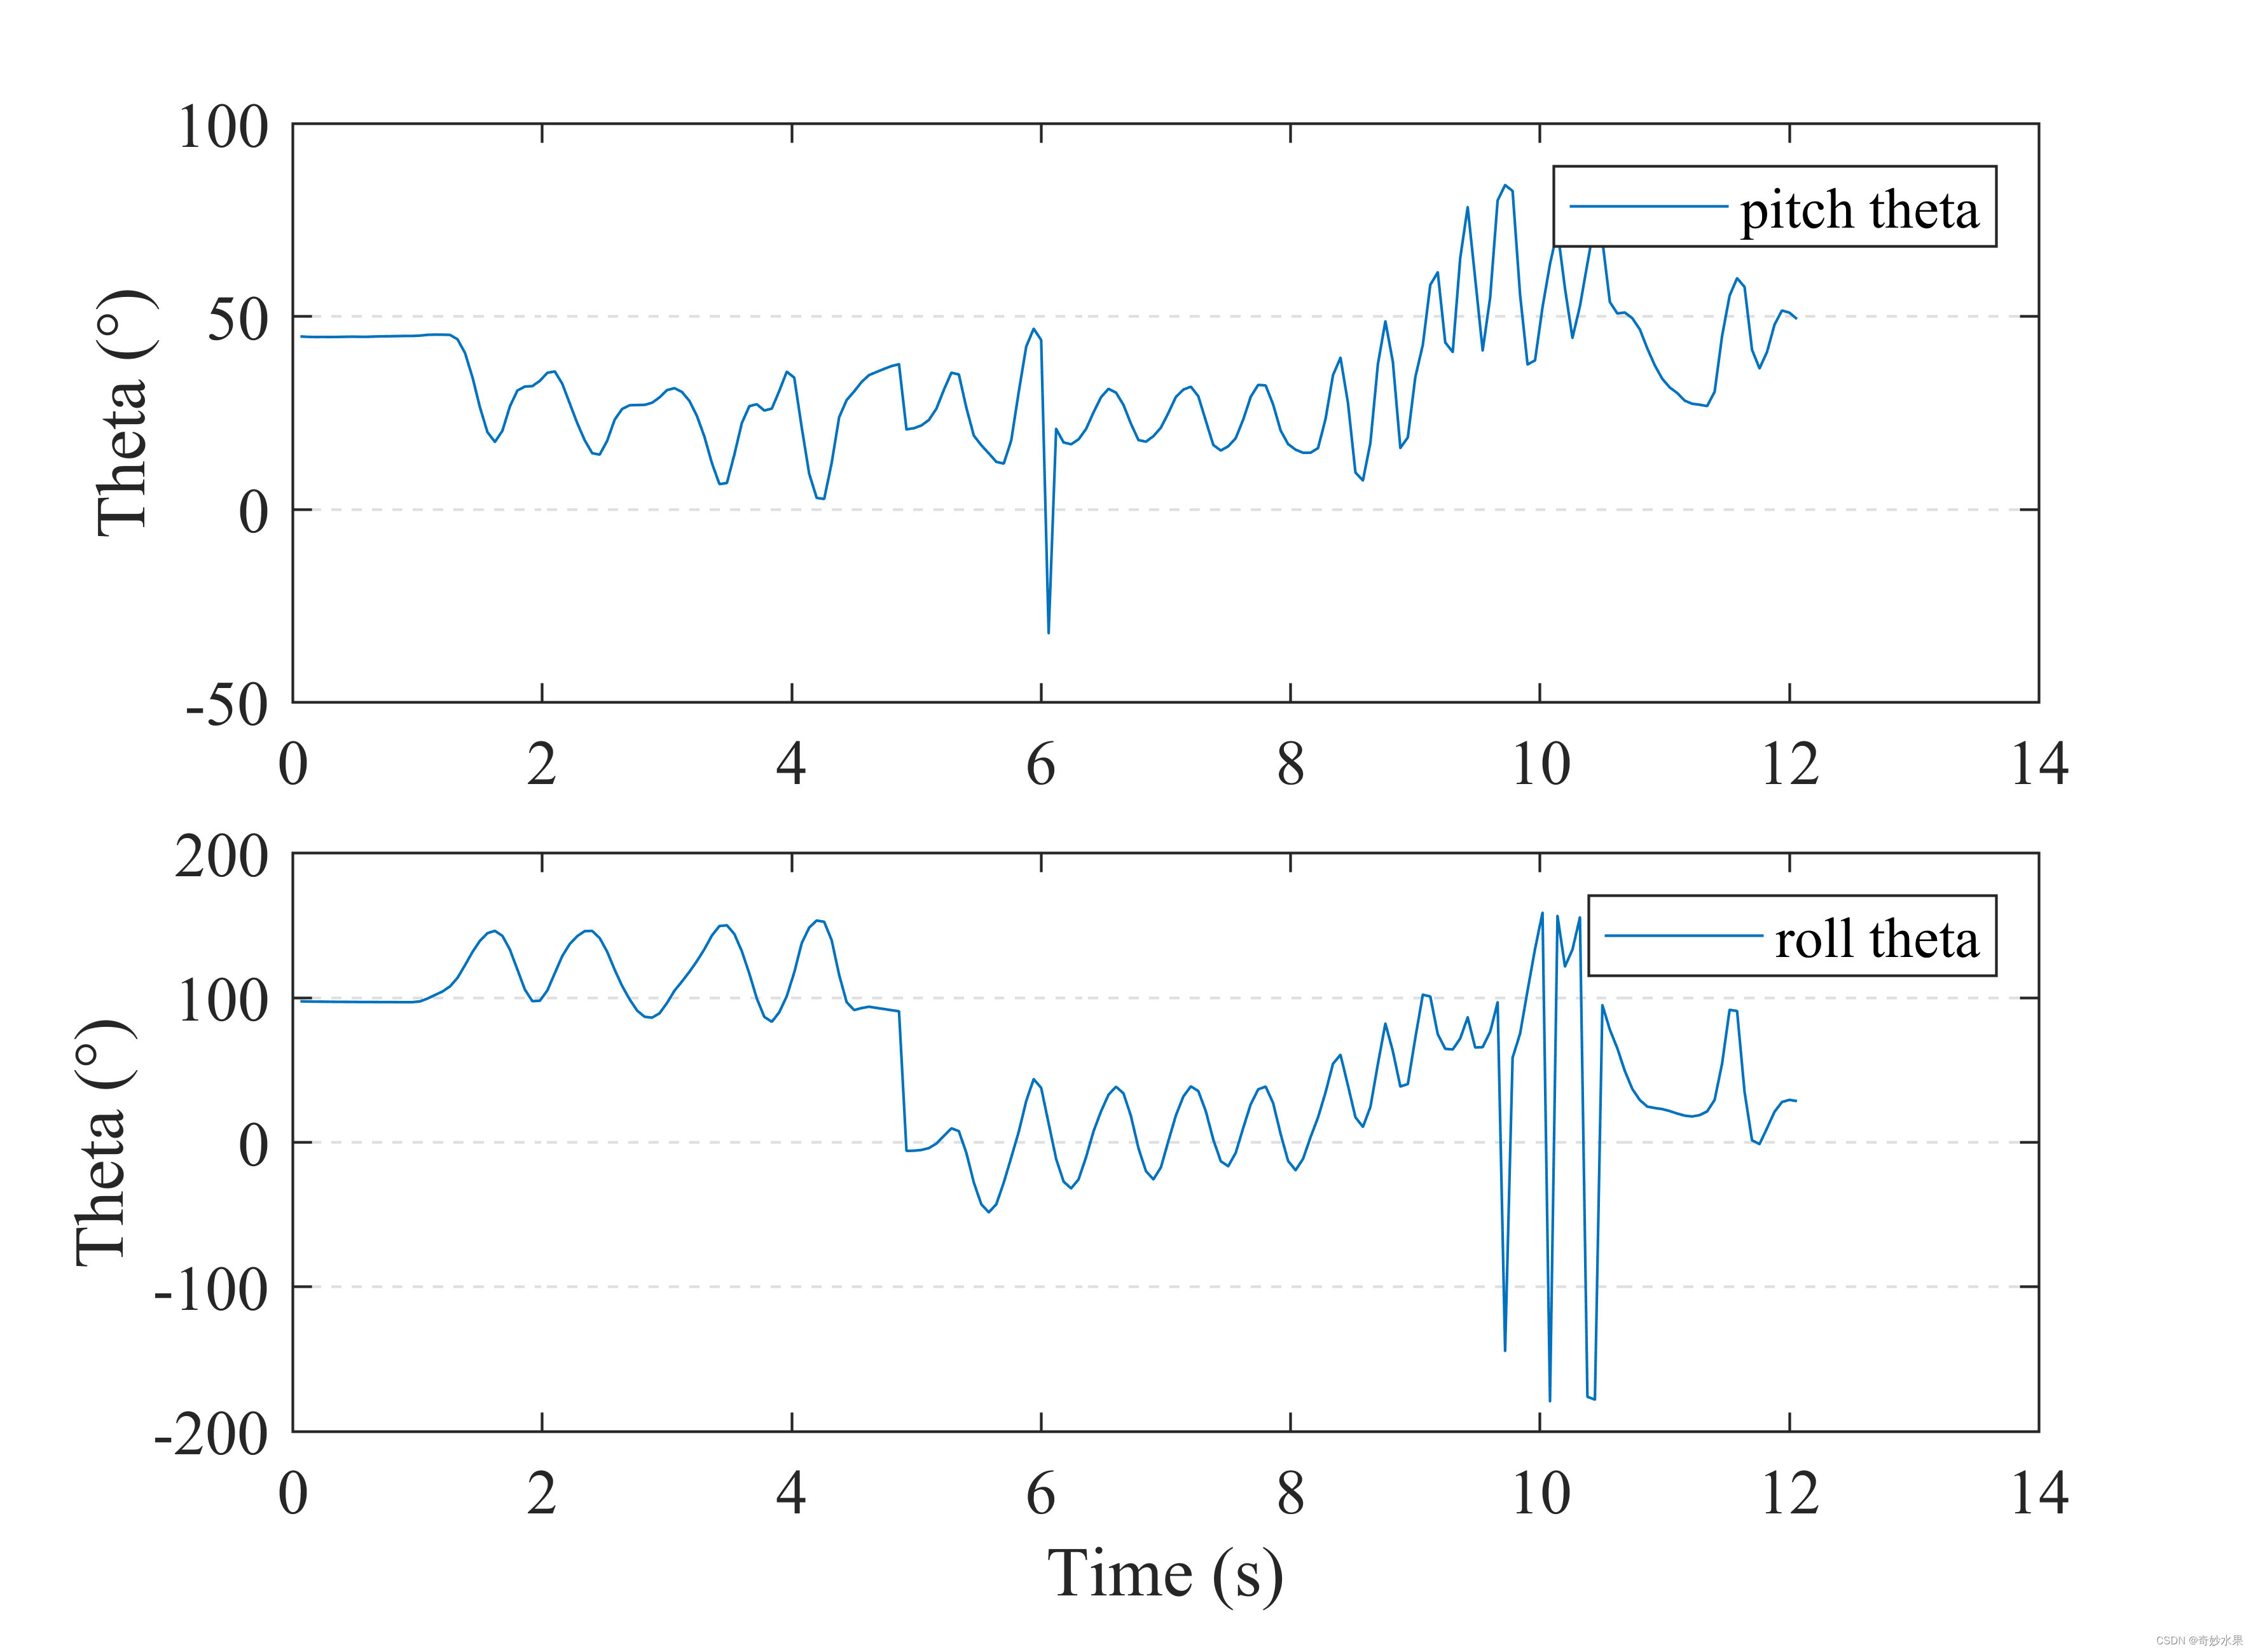
适用于实时九轴数据的源代码及处理结果图
源代码
clear;clc;
close alldata = importdata('Bewis_Record_nine00.txt');
[m_data,n_data] = size(data);b = 1;
theta = [ ];
for i = 1:m_data
a = mod(i,4);
if a == 0   %  0 equal theta, 1 equal magnetic, 2 equal acceleration, 3 equal angular velocitytheta = [theta data(i,1)];
end
b = b+1;
end
theta = theta.';%ref:https://www.bilibili.com/video/BV1464y1S7hc
fileID = fopen('beiwei001.txt','w+');
for i = 1:length(theta)
fprintf(fileID,'%s\r\n',theta{i,1});
end
fclose(fileID);filename = 'beiwei001.txt';
delimiterIn = ' ';
headerlinesIn = 0;
A = importdata(filename,delimiterIn,headerlinesIn);% generate x data
Ts = 0.06;
[m,n] = size(A.data(:,1));
t = (1:m)*Ts;% figure('Color','white')
% set(gcf,'color','w')% tiledlayout(2,1)
figure
tiledlayout(2,1,'TileSpacing','compact')
h = gcf;
h.Color = 'w';
h.Units = 'centimeters';
h.Position = [25 10 15 11];
% h.position = [20 10 15 7];ax1 = nexttile;
plot(ax1,t,A.data(:,1),'Displayname','pitch theta')
% set the style of ax1
ax1.FontName = 'times new roman';
ax1.FontSize = 12;
ax1.YLabel.String = 'Theta (°)';
% ax1.LabelFontSizeMultiplier = 0.9;
% legend('FontSize',12)
legend
% legend(ax1,{'Line 1'})
% ax1.Legend.TextColor = 'red';
ax1.YGrid = 'on';
ax1.GridLineStyle = '--';ax2 = nexttile;
plot(ax2,t,A.data(:,2),'Displayname','roll theta')% set the style of ax2
ax2.FontName = 'times new roman';
ax2.FontSize = 12;
% yline(0,'--')
ax2.YGrid = 'on';
ax2.GridLineStyle = '--';
ax2.XLabel.String = 'Time (s)';
ax2.YLabel.String = 'Theta (°)';
% legend(ax2,{'Line 1'})
% ax2.Legend
legend% export figure
% print('-djpeg','-r300','multi-variable-角度')
print('-dpng','-r600','multi-variable-角度')
% print('-painters','-dpdf','multi-variable-角度')
% print('-painters','-dmeta','multi-variable-角度')
运行结果图
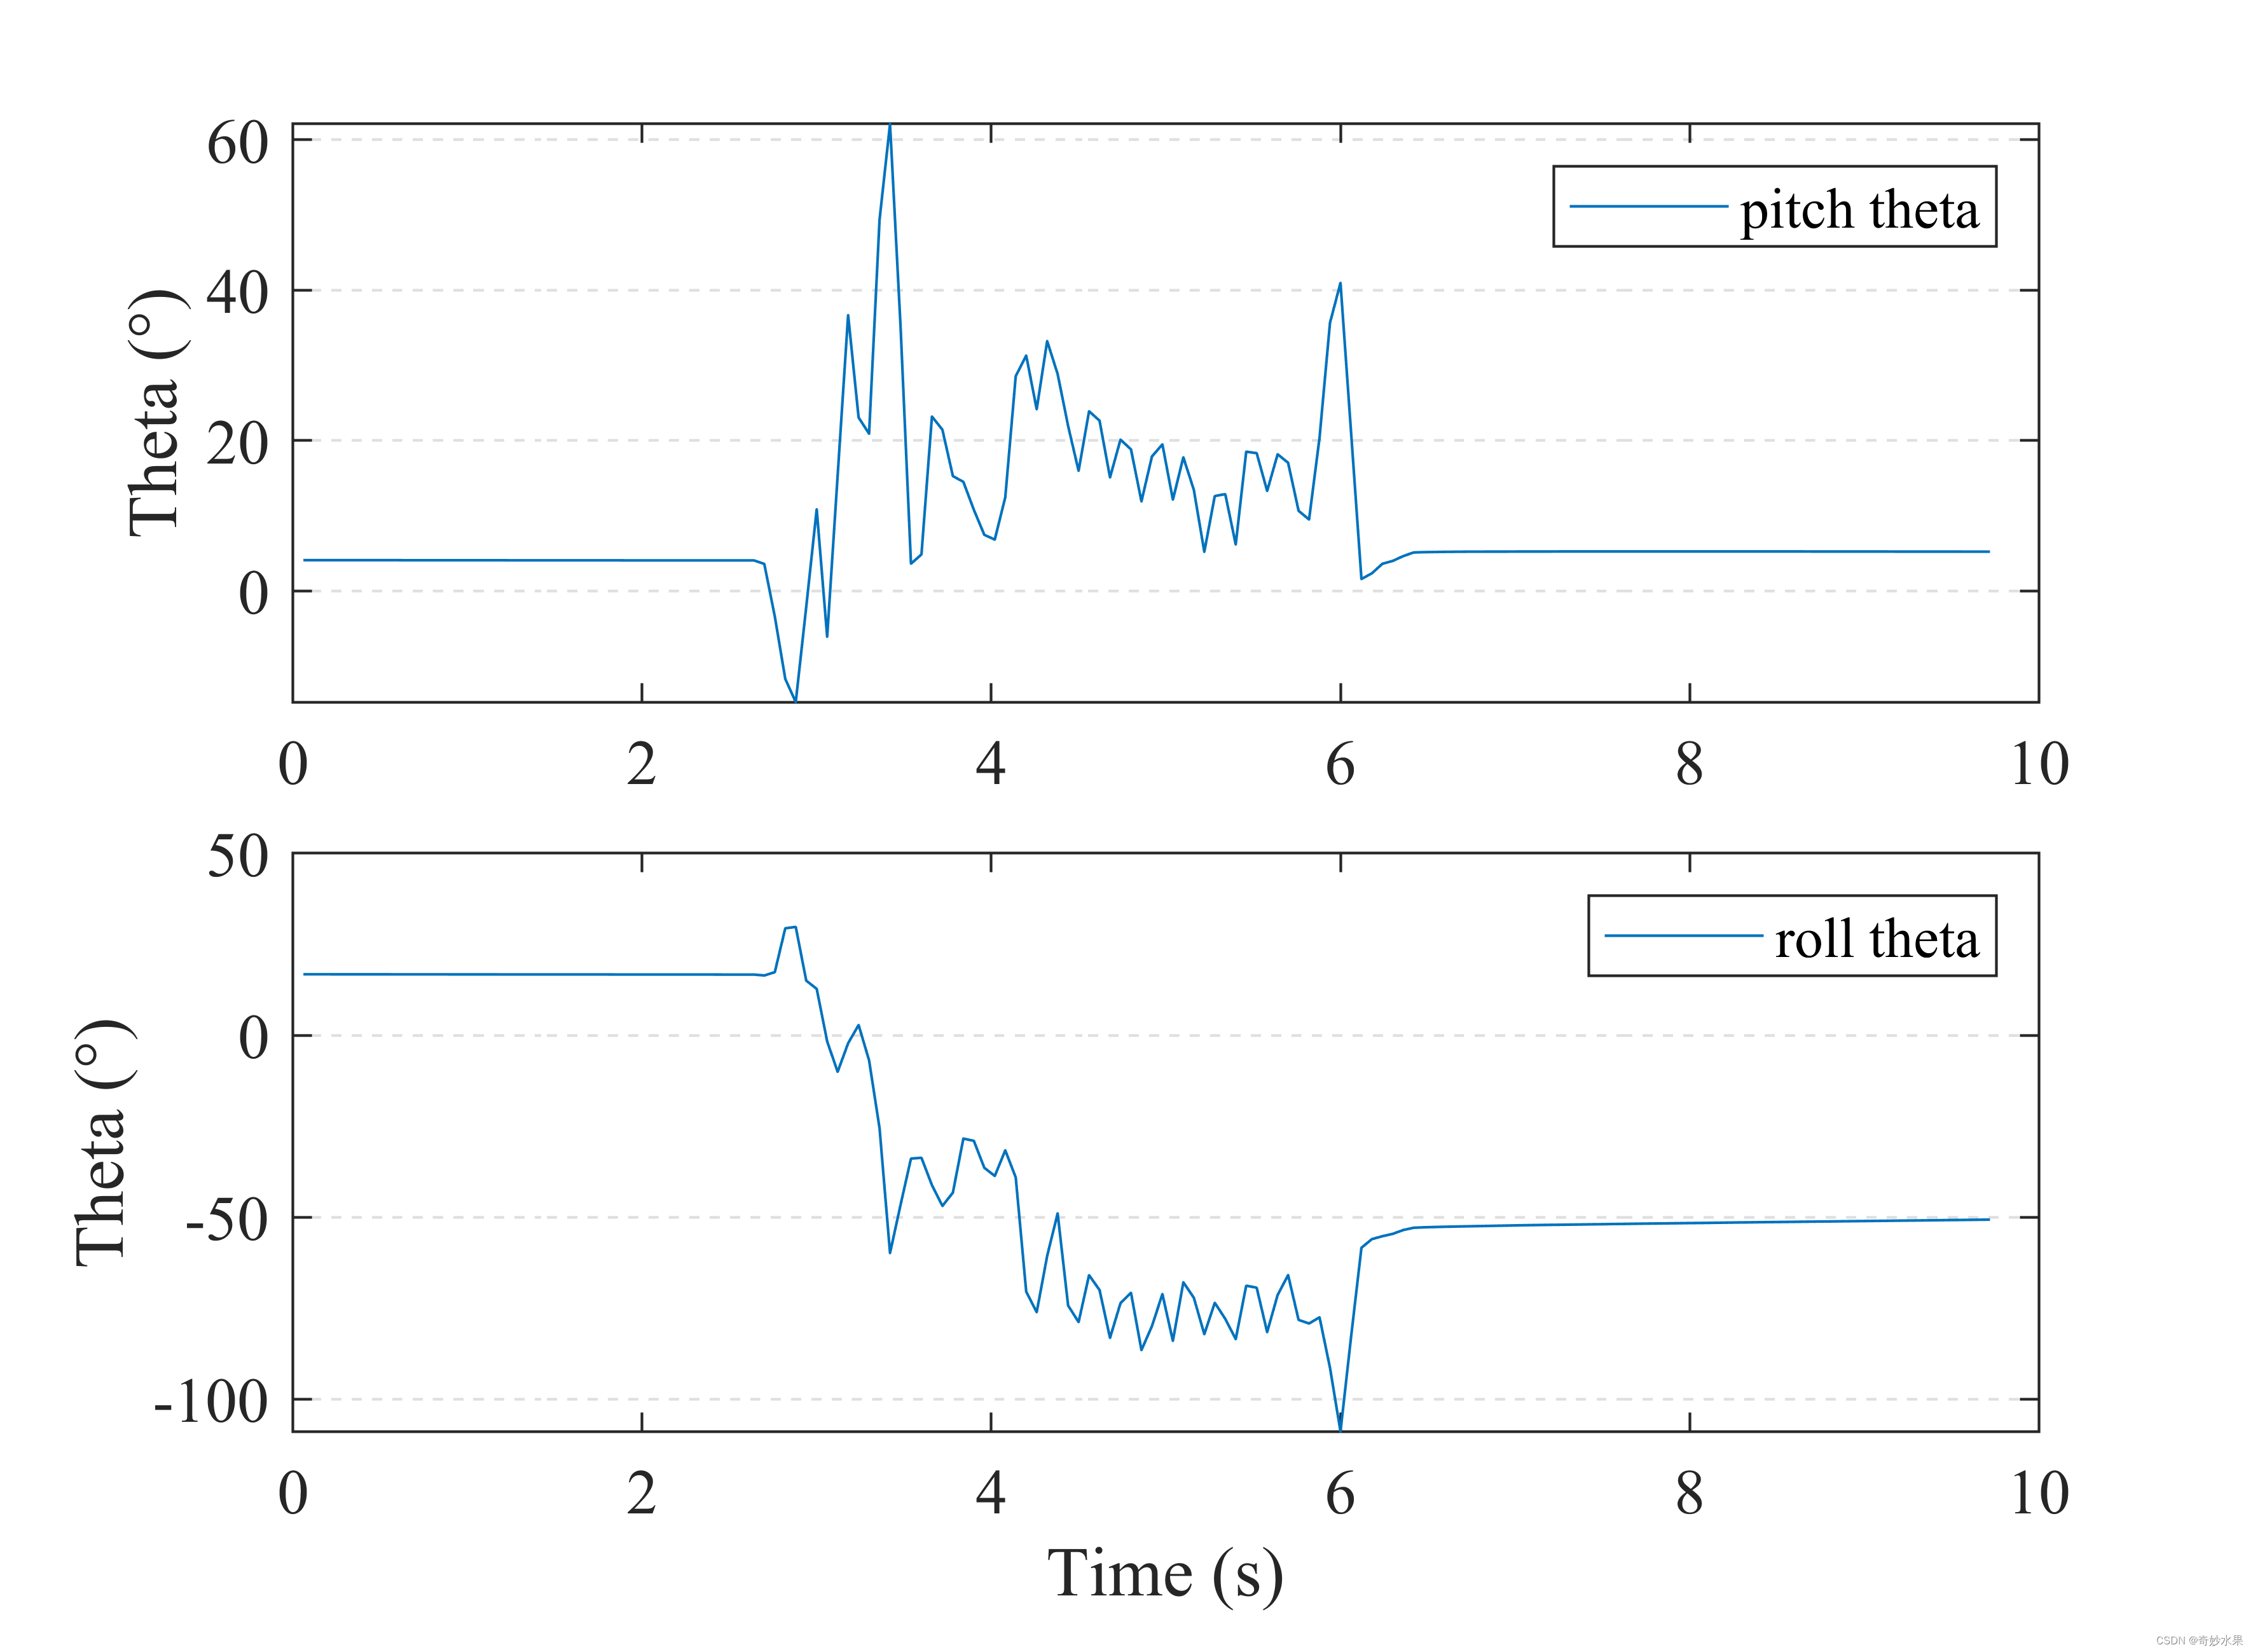
官方文档对图片格式中字体大小的解释

参考资料
【1】https://ww2.mathworks.cn/help/matlab/ref/tiledlayout.html
【2】https://ww2.mathworks.cn/help/matlab/ref/matlab.graphics.layout.tiledchartlayout-properties.html
【3】https://ww2.mathworks.cn/help/matlab/ref/legend.html
【4】https://ww2.mathworks.cn/help/matlab/ref/importdata.html
【5】https://ww2.mathworks.cn/help/matlab/ref/matlab.graphics.axis.axes-properties_zh_CN.html
【6】https://www.bilibili.com/video/BV1464y1S7hc
下一篇:C++初阶——入门(1)
相关内容
热门资讯
AI做攻略、“双向奔赴”……国...
本文转自:人民网人民网记者 许维娜今年国庆假期,AI(人工智能)成了不少年轻人的“旅行搭子”。行前做...
合肥的这个“梗”, 翻篇了
社交平台的评论区,曾长期流传一句专属于合肥的黑色幽默。有人问合肥哪里好玩,本地网友半开玩笑地回复:合...
7万+旅游中高层都在的群,今天...
做旅游这行,资源卡位、渠道互通、项目落地——往往就差一个“对的机会”。我们的行业社群已聚集70,00...
一场帐篷音乐节,如何让井研从“...
帐篷音乐节现场封面新闻记者 周洪攀10月的研溪湿地,晚风里裹着柑橘的清甜与民谣的回响。夜幕降临,10...
白鹤翩翩落星愿,上海迪士尼度假...
10月9日,世界候鸟日前夕,上海迪士尼度假区星愿公园的湖风里多了一分白鹤的灵动。三座白鹤雕塑正式揭幕...
成都锦江边赏初秋枫叶飘飘
目前,成都锦江边国华街枫叶树红了。近年来,国华街附近的几条街都栽种了红枫树,是城区较集中看枫叶的点位...
GBTA:商务旅行正在复苏,但...
亚太正在成为全球商务旅行增长的重要引擎。在经历疫情后的快速反弹之后,全球商务旅行正在进入一个新的增长...
从景区焕新到节赛引流 邹城双节...
齐鲁网·闪电新闻10月9日讯 中秋、国庆“双节”假期,邹城市文化和旅游局提前谋划、周密部署,立足自身...
江山如此多娇 且看石楼今朝
金秋十月,黄河岸畔秋意盎然,丰收盛会喜迎国庆。本次石楼国庆文旅活动以“江山如此多娇,且看石楼今朝”为...
海南国庆假期接待游客475.4...
2026年国庆假期,海南接待游客475.40万人次,较2025年增长13.1%,较2024年增长15...