
Windows_安装整合Prometheus + Grafana监控主机和Flink作业
安装包下载
prometheus
windows_exporter
pushgateway
grafana
除了prometheus和flink的main函数代码需要修改外,其余直接bin/对应启动exe运行即可,注意默认端口即可(下文有)。
需要修改的配置
只需要修改:prometheus.yml(增加两个静态地址):
scrape_configs:# The job name is added as a label `job=` to any timeseries scraped from this config.- job_name: "prometheus"# metrics_path defaults to '/metrics'# scheme defaults to 'http'.static_configs:- targets: ["localhost:9090"]#win- job_name: "node_exporter"scrape_interval: 5smetrics_path: "/metrics" static_configs:- targets: ["localhost:9182"]# 添加 PushGateway 监控配置- job_name: 'pushgateway'honor_labels: truestatic_configs:- targets: ['localhost:9091']labels:instance: 'pushgateway'
作业代码
本地启动作业:
引入对应的pom依赖,如果在linux下通过Flink客户端编译,则将其放入对应的lib下:
Maven地址:Flink的prometheus整合依赖
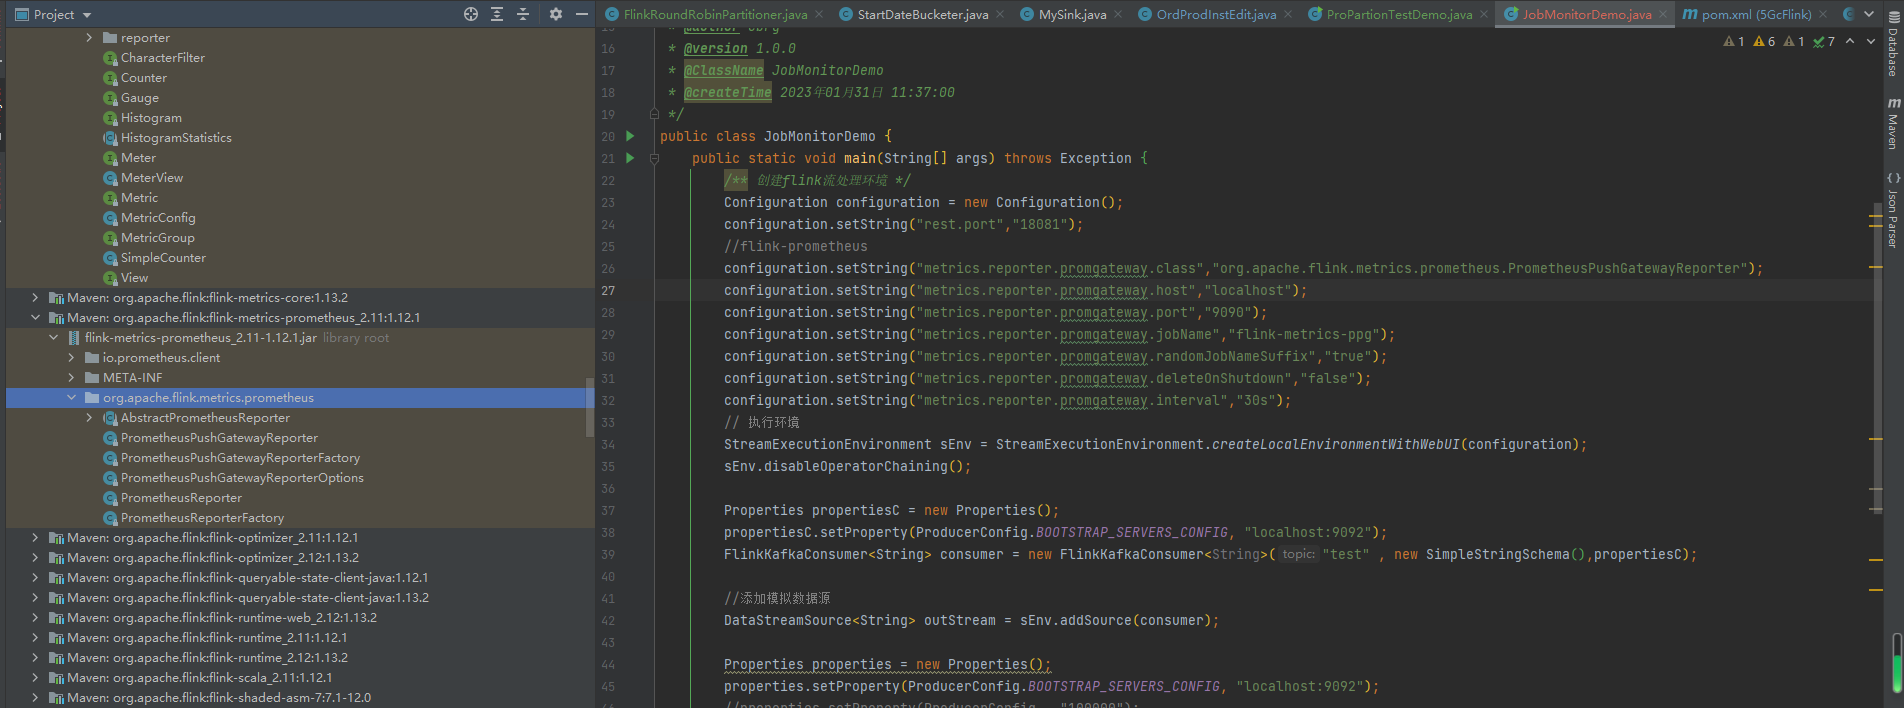
完整依赖参考:分区文章:略。 本地IDEA开发,修改代码核心注意几个对应Flink客户端flink-conf.yaml的参数:
public class JobMonitorDemo {public static void main(String[] args) throws Exception {/** 创建flink流处理环境 */Configuration configuration = new Configuration();configuration.setString("rest.port","18081");//flink-prometheusconfiguration.setString("metrics.reporter.promgateway.class","org.apache.flink.metrics.prometheus.PrometheusPushGatewayReporter");configuration.setString("metrics.reporter.promgateway.host","localhost");configuration.setString("metrics.reporter.promgateway.port","9091");configuration.setString("metrics.reporter.promgateway.jobName","flink-metrics");configuration.setString("metrics.reporter.promgateway.randomJobNameSuffix","true");configuration.setString("metrics.reporter.promgateway.deleteOnShutdown","false");configuration.setString("metrics.reporter.promgateway.interval","30s");// 执行环境StreamExecutionEnvironment sEnv = StreamExecutionEnvironment.createLocalEnvironmentWithWebUI(configuration);sEnv.disableOperatorChaining();Properties propertiesC = new Properties();propertiesC.setProperty(ProducerConfig.BOOTSTRAP_SERVERS_CONFIG, "localhost:9092");FlinkKafkaConsumer consumer = new FlinkKafkaConsumer("test" , new SimpleStringSchema(),propertiesC);//添加模拟数据源DataStreamSource outStream = sEnv.addSource(consumer);Properties properties = new Properties();properties.setProperty(ProducerConfig.BOOTSTRAP_SERVERS_CONFIG, "localhost:9092");//properties.setProperty(ProducerConfig., "100000");properties.setProperty("akka.ask.timeout" , "120s");properties.setProperty("web.timeout" , "120000");outStream.print();FlinkKafkaProducer producer = new FlinkKafkaProducer("partitionTest", new SimpleStringSchema(),properties , Optional.of(new FlinkRoundRobinPartitioner<>()));//, new FlinkRoundRobinPartitioner<>(),  FlinkKafkaProducer.Semantic.AT_LEAST_ONCE, 5);/** 输出数据流绑定到生产者 */outStream.addSink(producer);outStream.print();sEnv.execute("partitionTest");}
}
实现样例
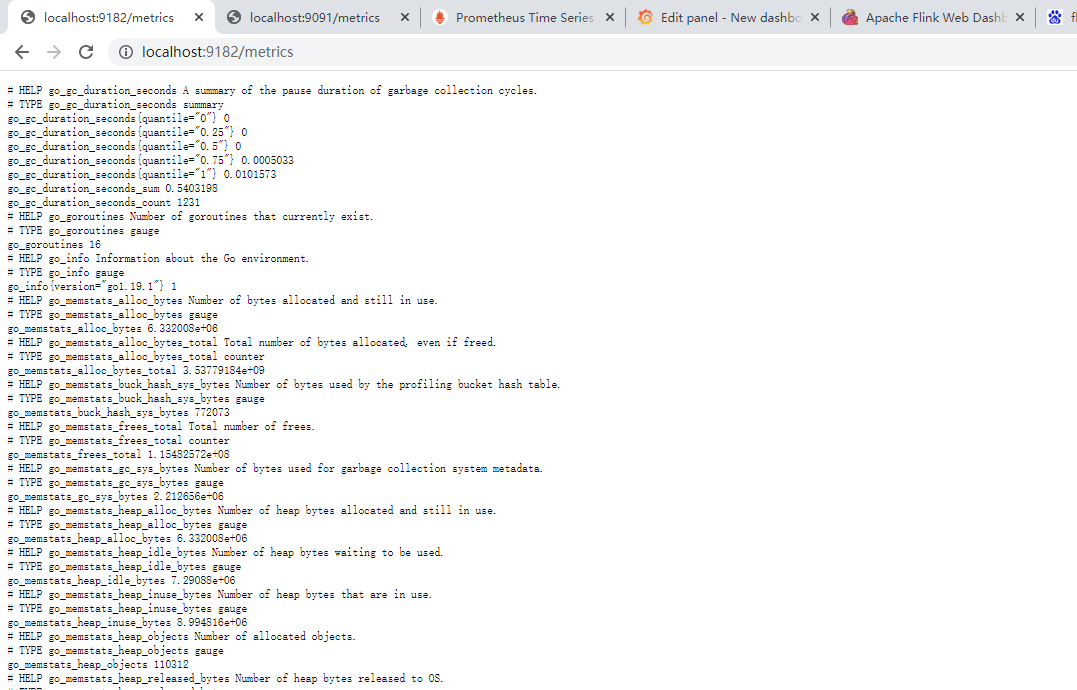
启动windows-Exporter(默认端口9182,http://localhost:9182/metrics,作用主要为监听到主机的CPU 使用率, 这里在对应上Grafana里面的metrics就是windows_xxx) ,
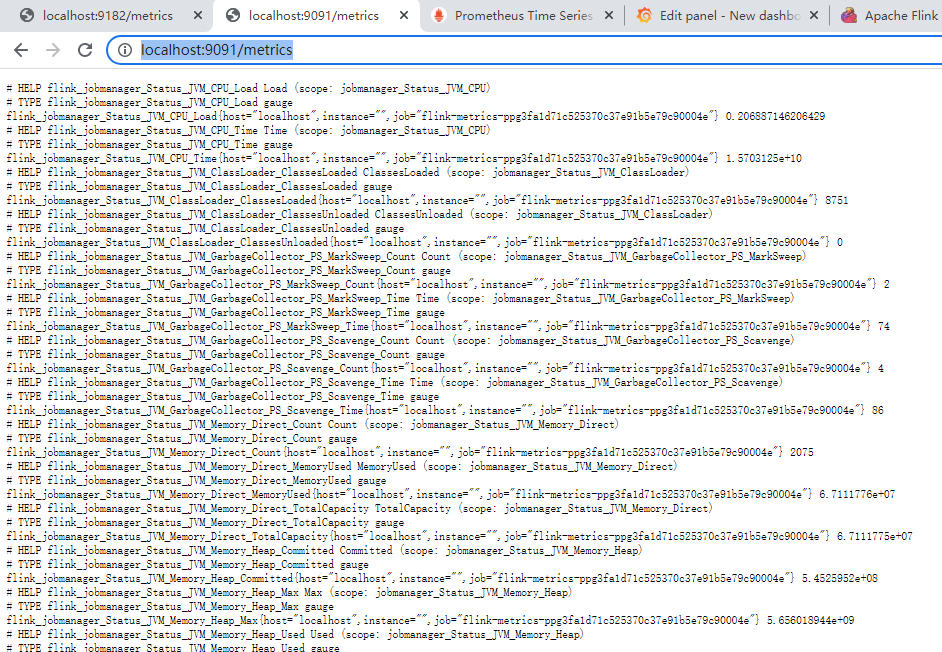
启动pushgateway(默认端口9091,http://localhost:9091/metrics,作用主要与flink内嵌的flink-metrics-prometheus呼应连接)
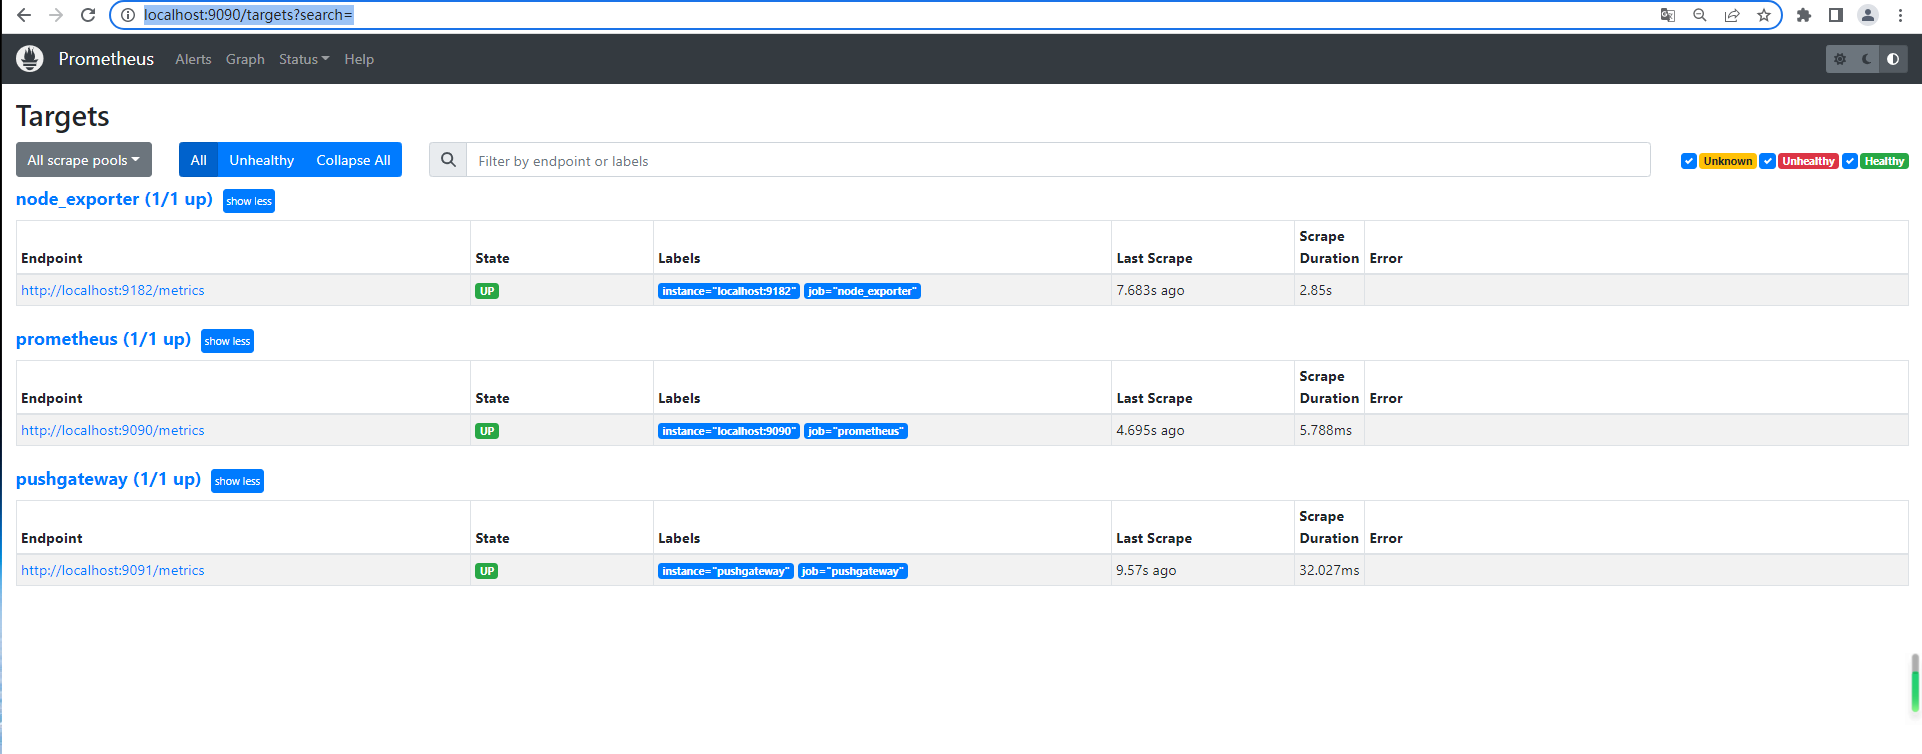
启动普罗米修斯(默认端口9090,http://localhost:9090/targets?search=),查看targets:
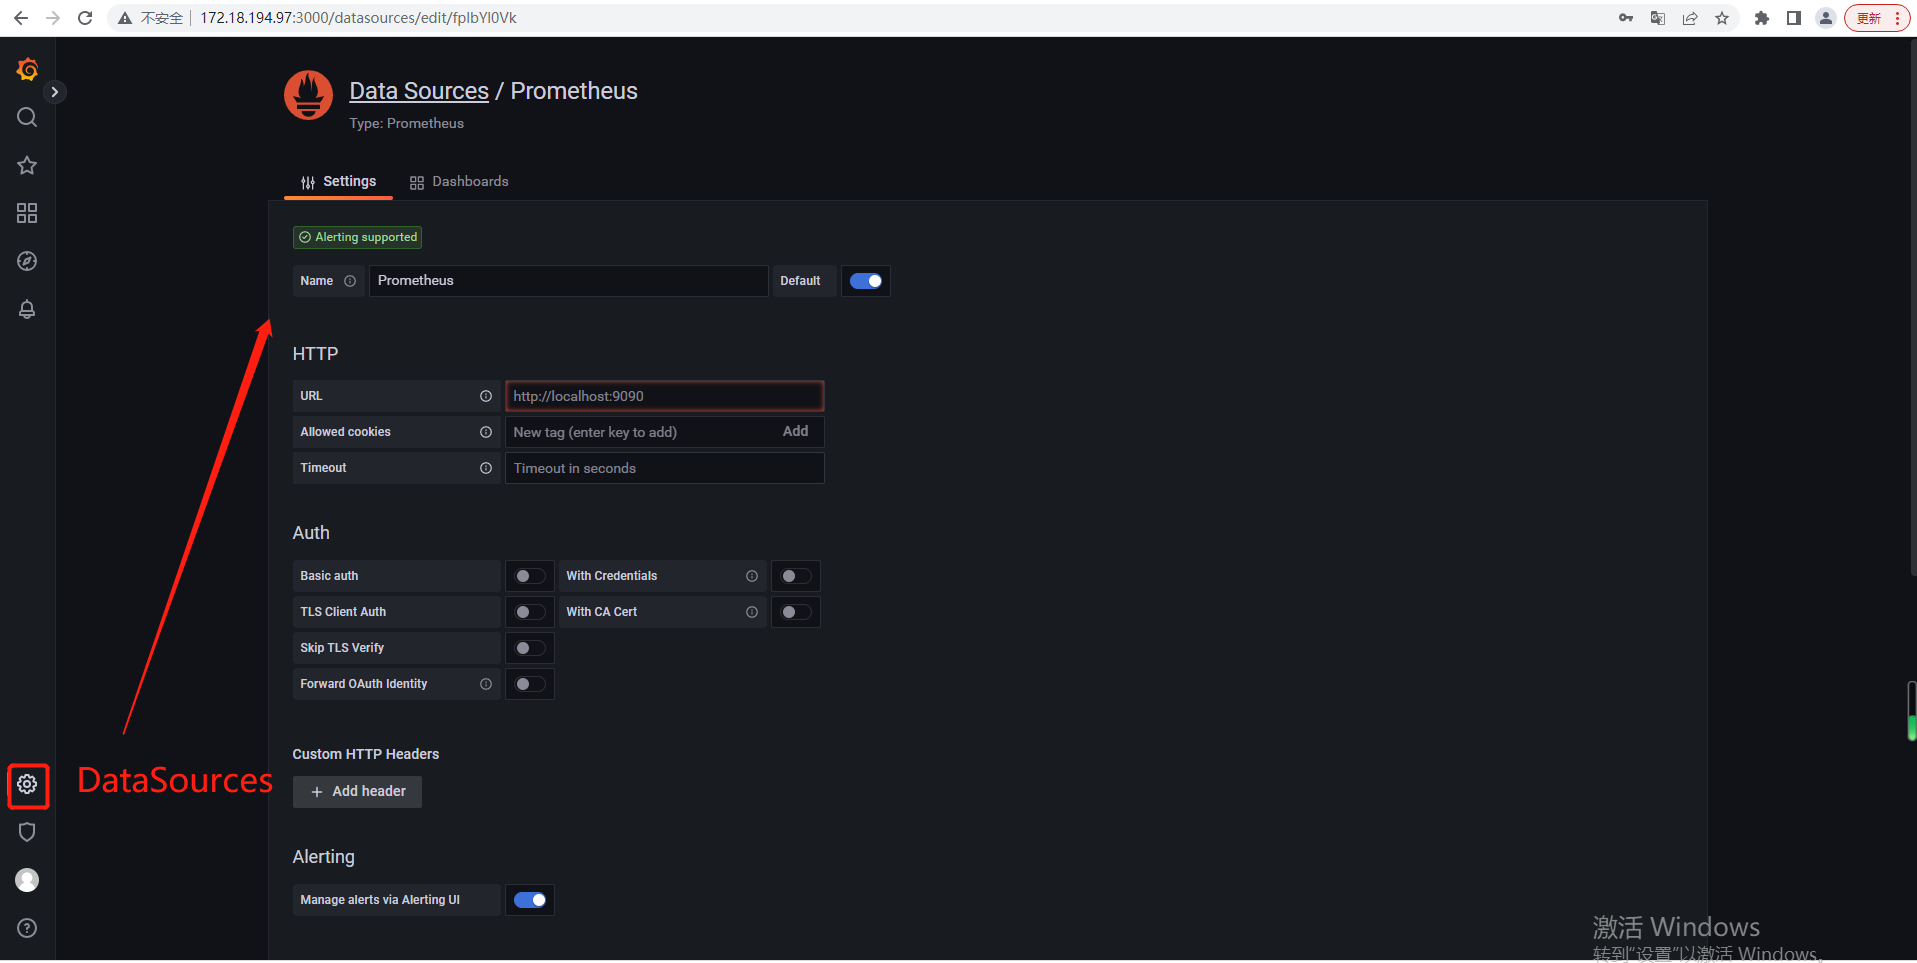
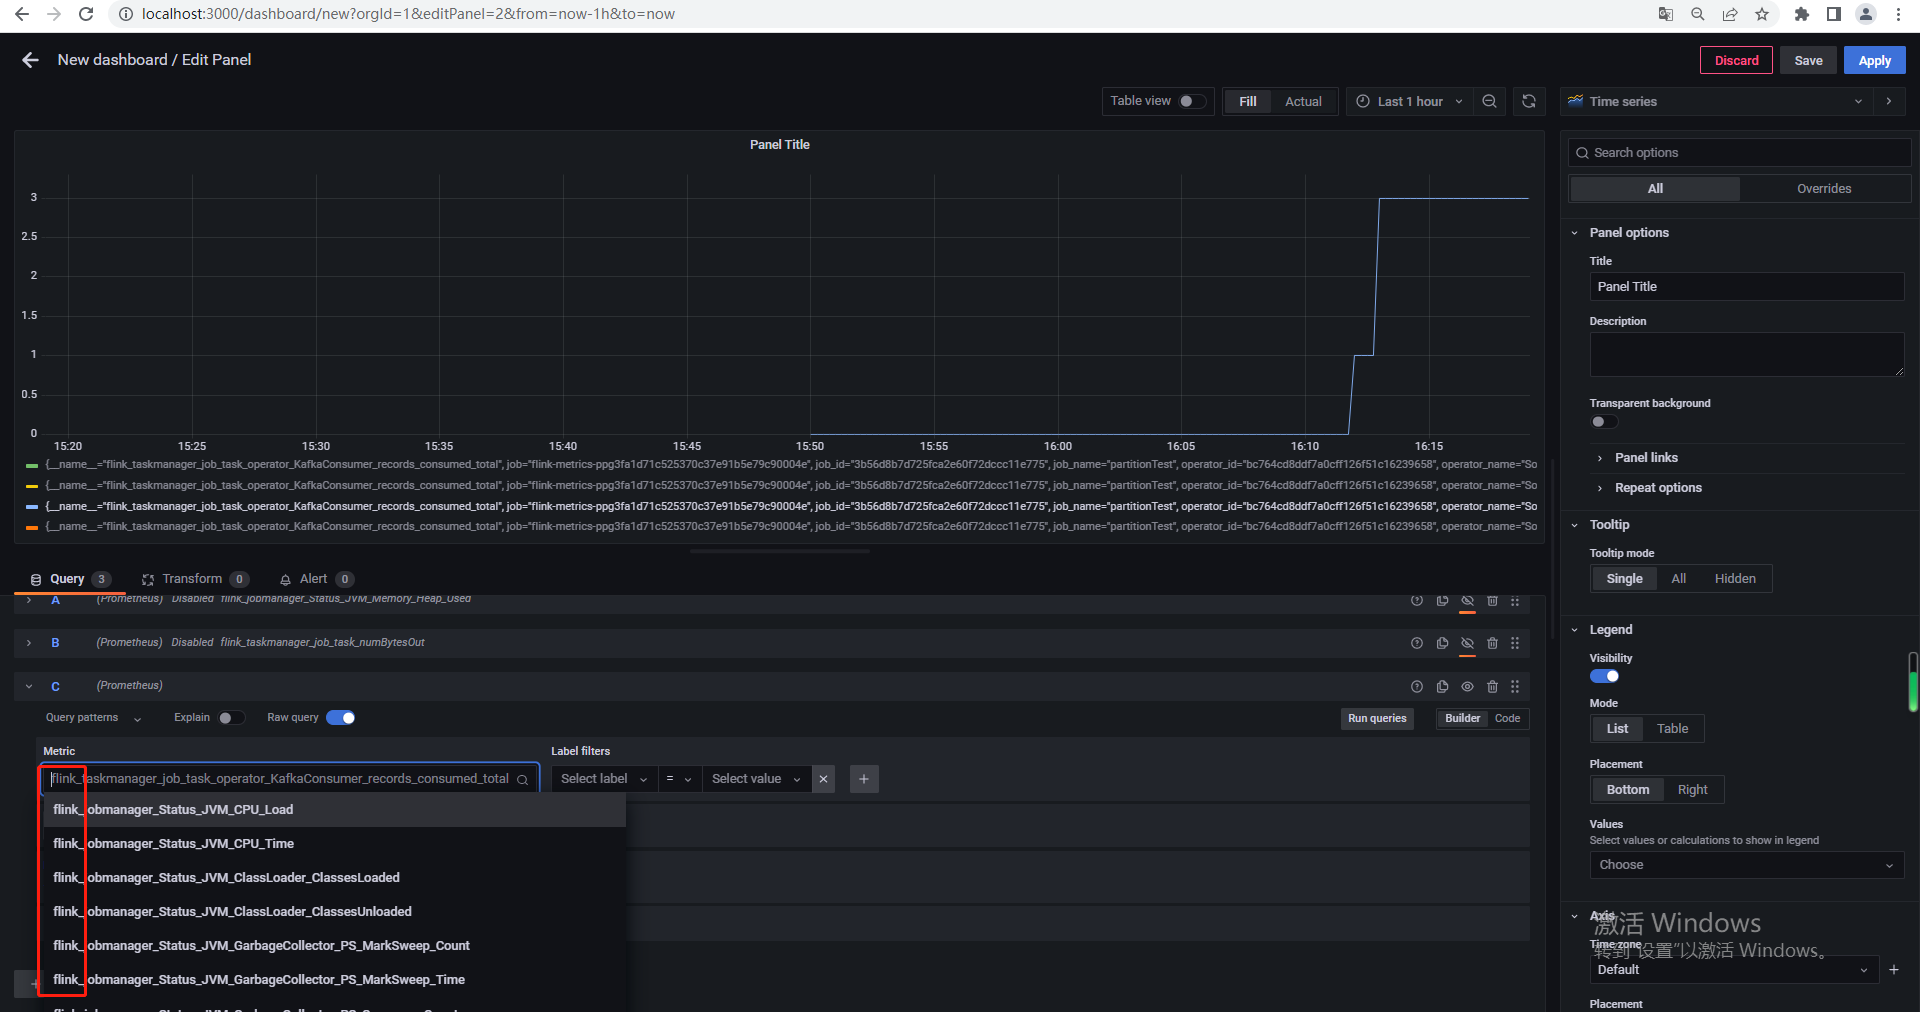
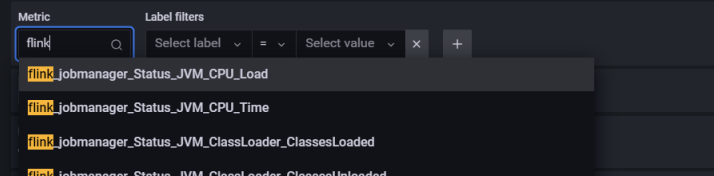
启动运行grafana,默认账户admin/admin ,先在setting里面关联上Prometheus作为数据源,再新增dashboard,在qurey里面的metrics中选择:
配置好普罗米修斯数据源:
http://localhost:9090/
如果只启动了windows_exploer则只有:

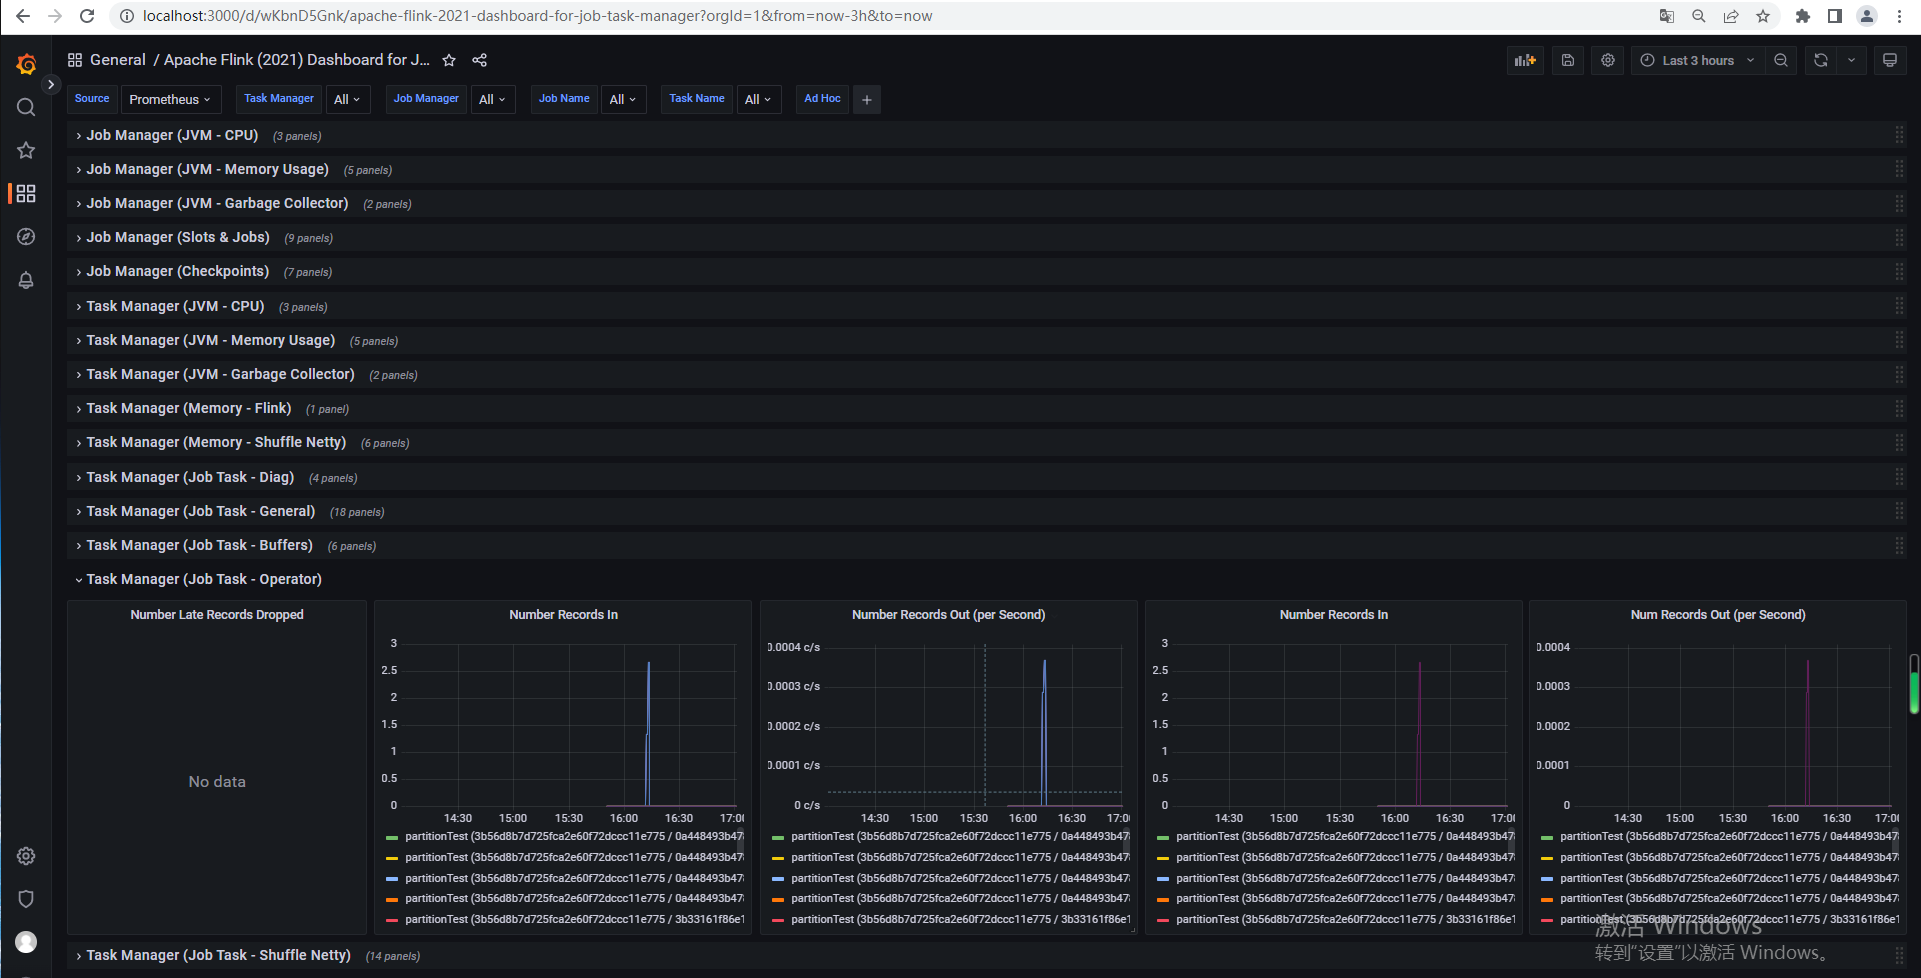
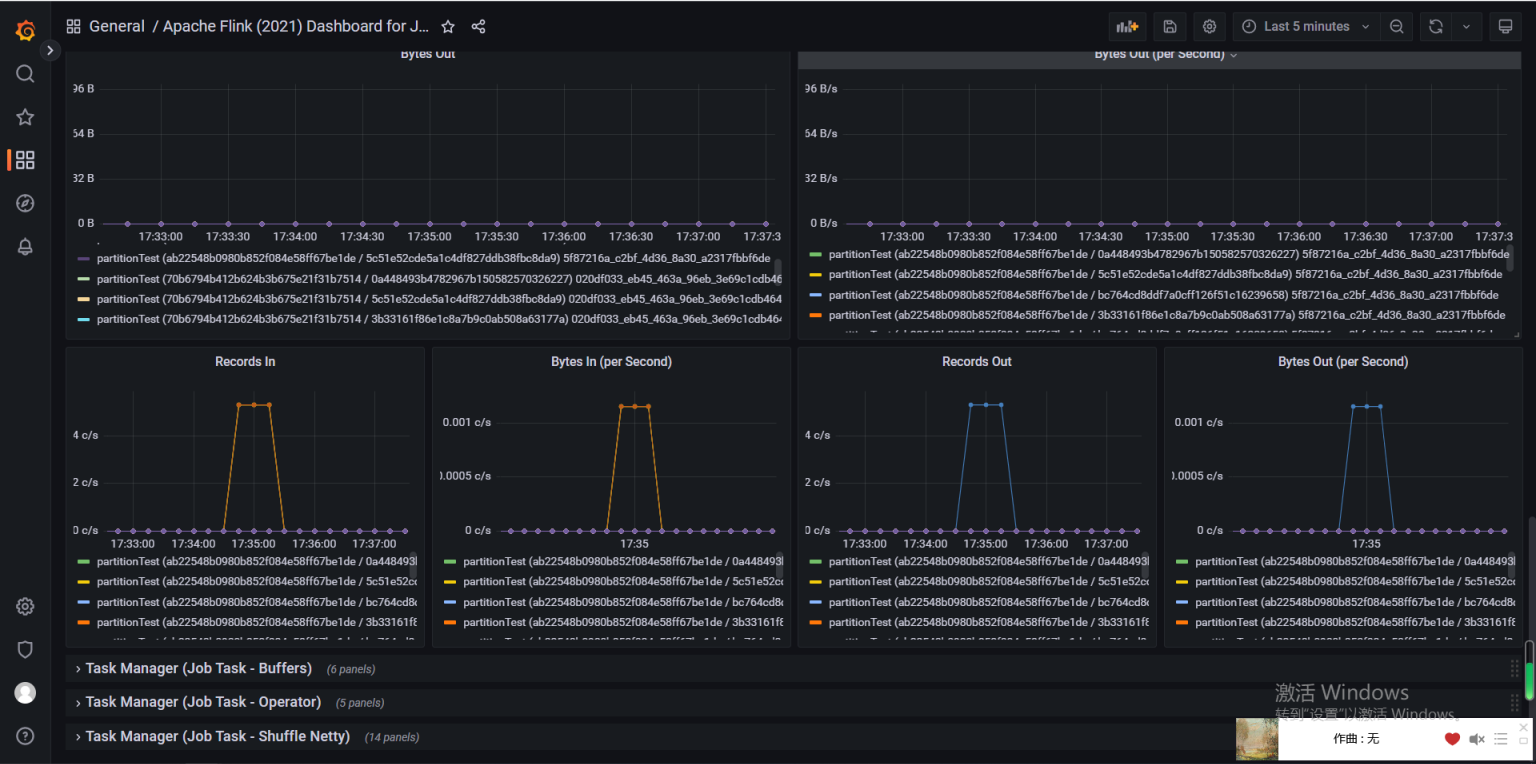
要想获得对应的flink监控图,idea运行本地flink作业,该作业以k2f为例,本地生产若干条数据对应指标变化:
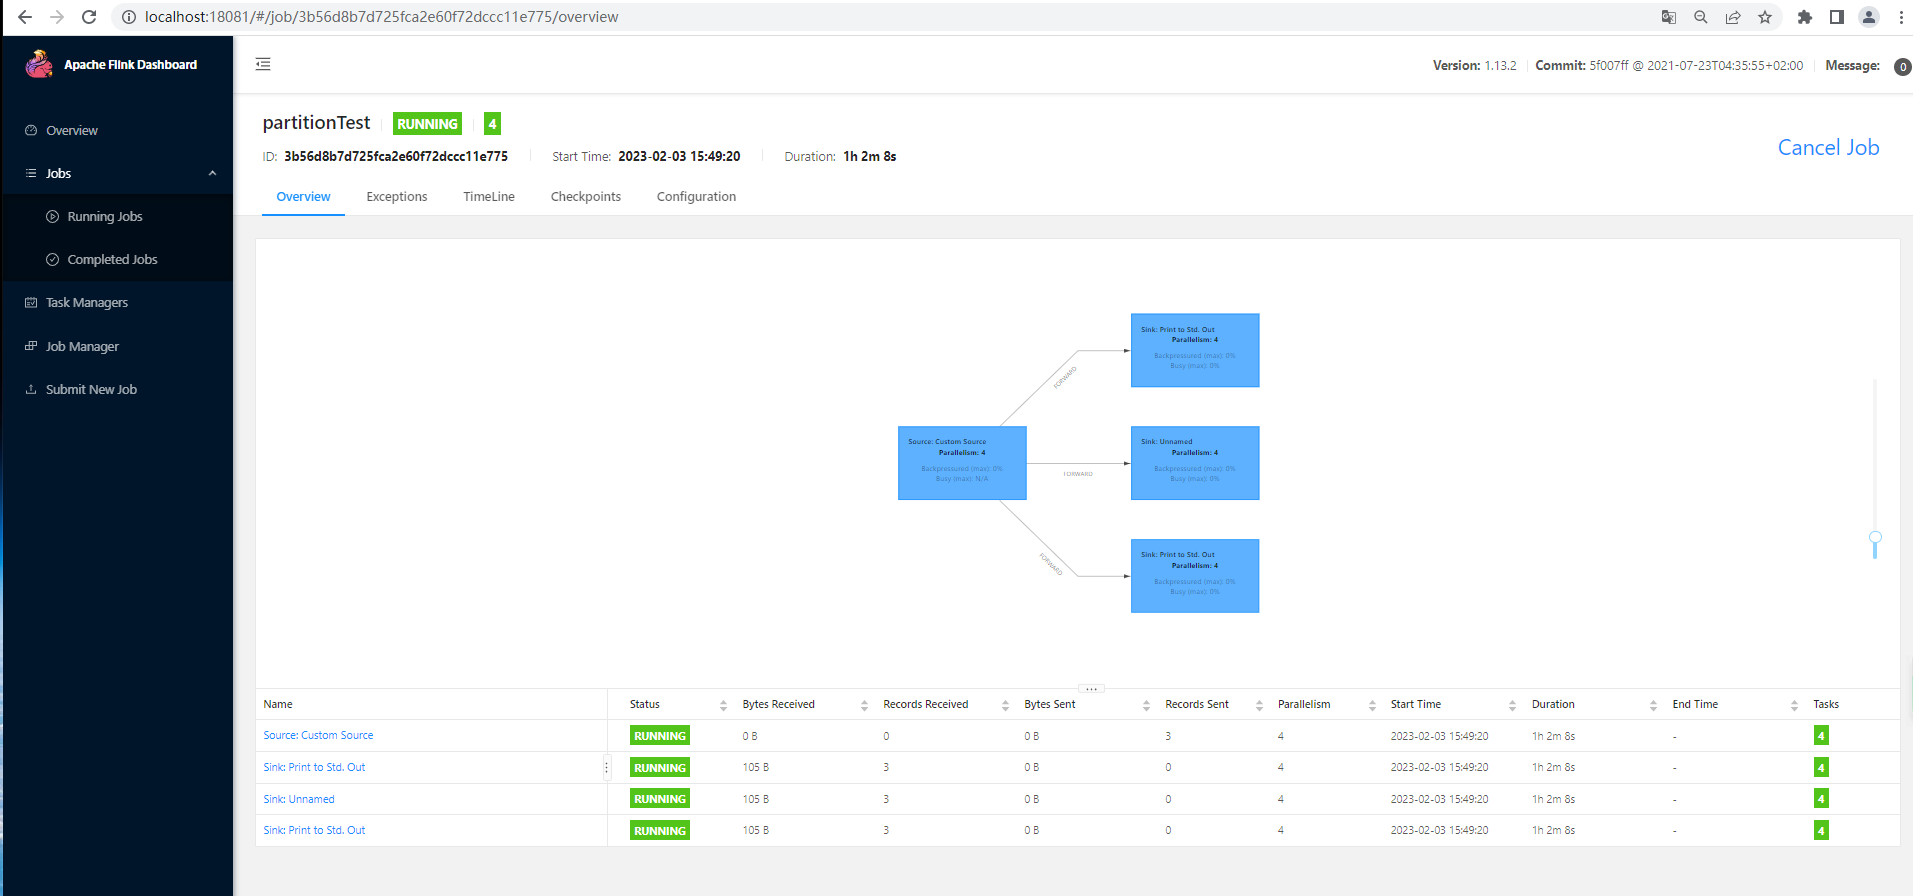
对以上grafana中选择的指标是,对应Consumer算子【四个并行度(暴露cpu核数了)】:
使用进阶
手动一个个添加 Dashboard 比较繁琐,Grafana 社区鼓励用户分享 Dashboard,通过https://grafana.com/dashboards 网站,可以找到大量可直接使用的 Dashboard 模板。
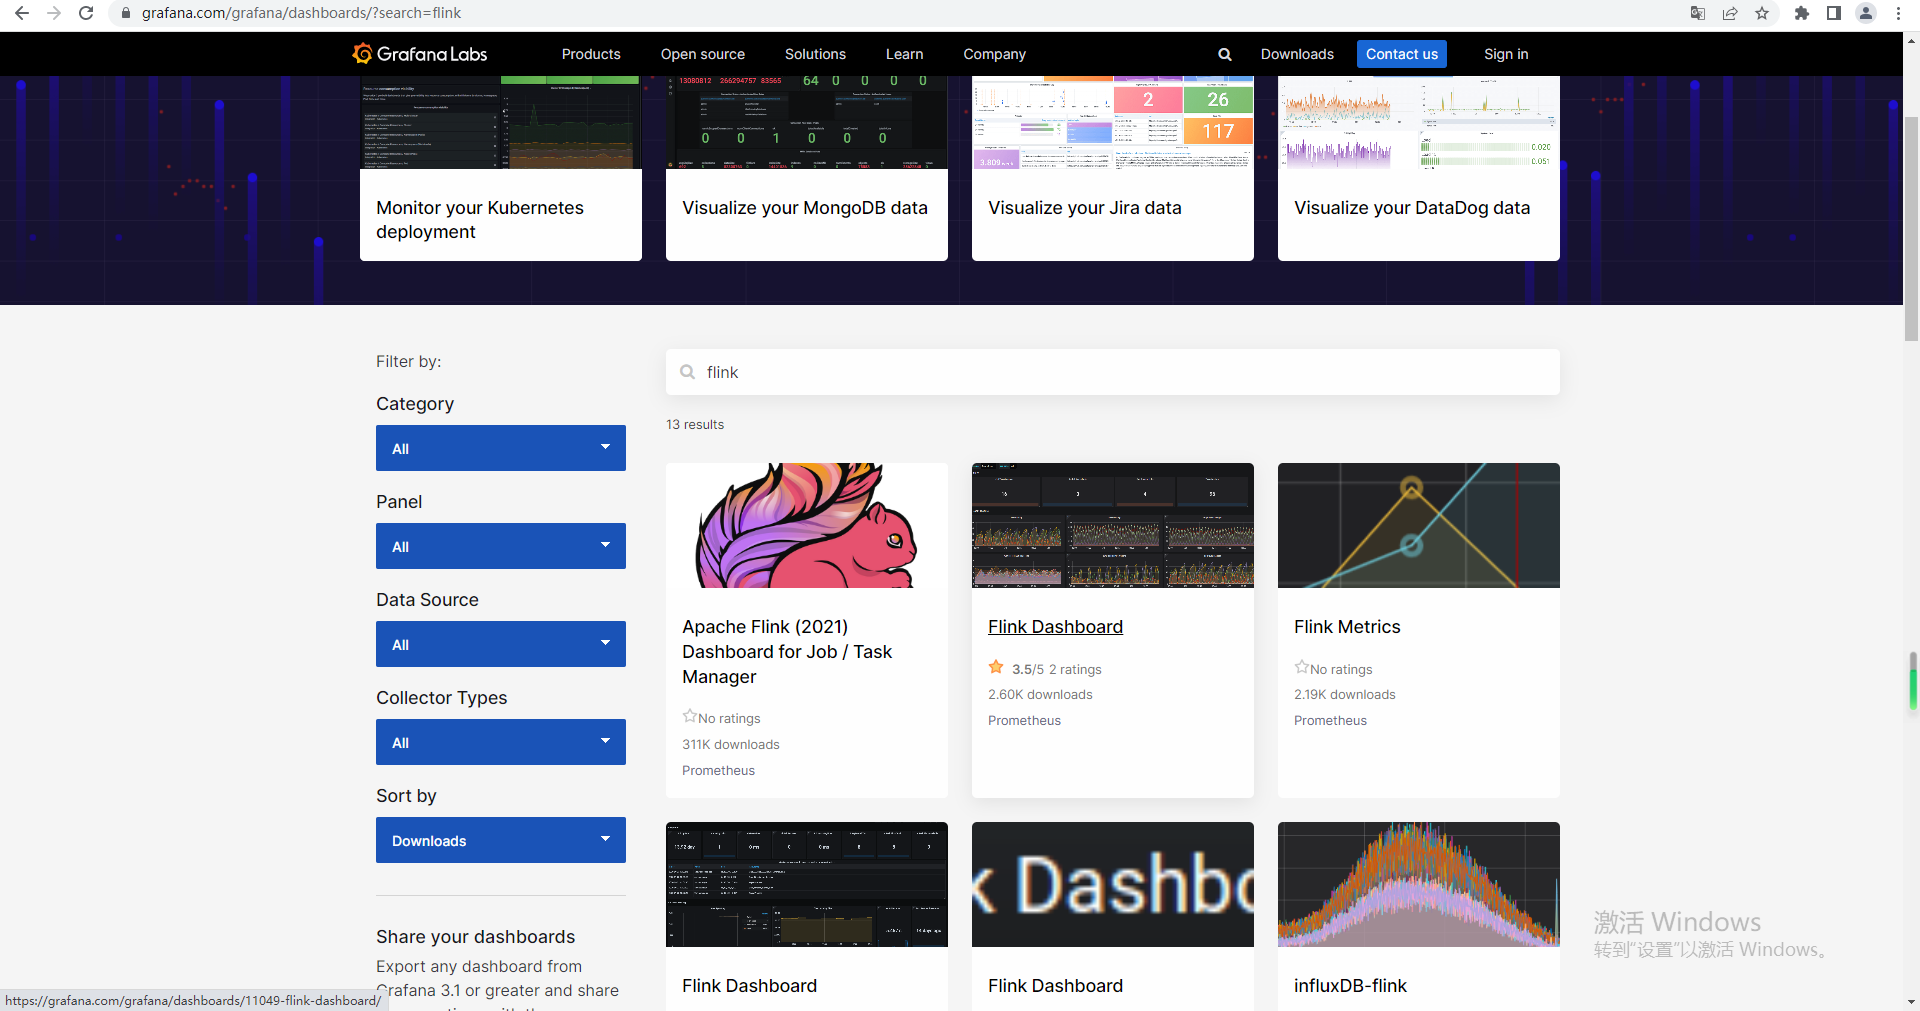
导入(新建)dashboard:
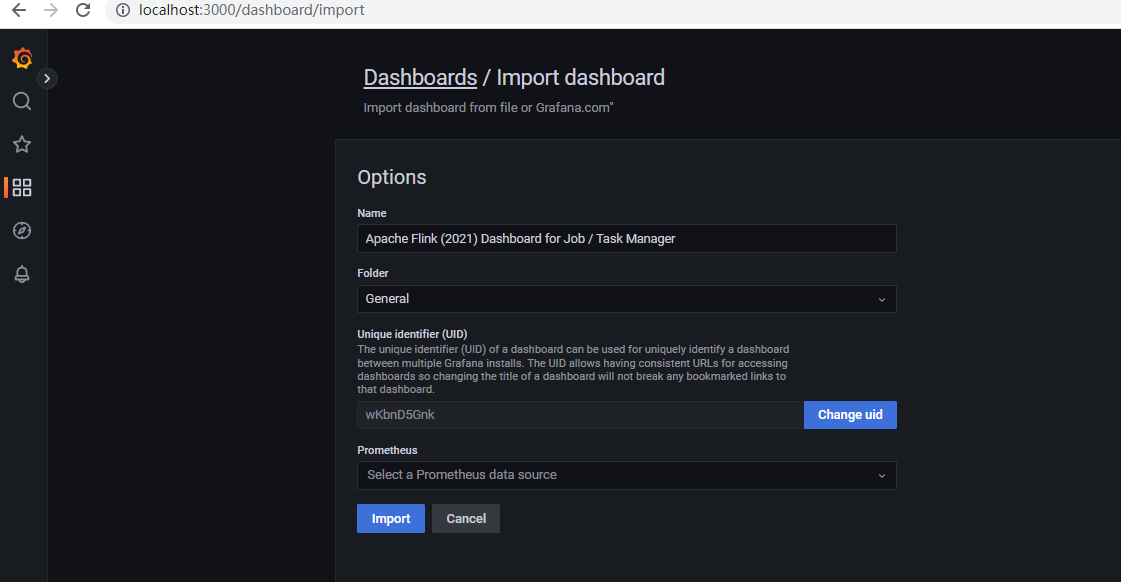
引入Json模板的数据面板:
告警
Grafana告警这里有三个概念组成:
- Alerting | Contact points
- Alerting | Notification policies
- Alerting | Alert rules
参考blog:Prometheus系列之Grafana 版本9.0.0 设置Email邮件报警实战
彻底搞懂监控系统,使用Prometheus和Grafana 如何实现运维告警
首先配置开启smtp邮件服务,类似参考spring-admin,修改Grafana/conf/default.ini:
#################################### SMTP / Emailing #####################
[smtp]
enabled = true
host = smtp.qq.com:25		#邮件类型
user = yourEmail@qq.com	#邮件地址
# If the password contains # or ; you have to wrap it with triple quotes. Ex """#password;"""
password = xxx	#授权码
cert_file =
key_file =
skip_verify = true
from_address = yourEmail@qq.com
from_name = Grafana
ehlo_identity = dashboard.example.com
startTLS_policy =[emails]
welcome_email_on_sign_up = false
templates_pattern = emails/*.html, emails/*.txt
content_types = text/html
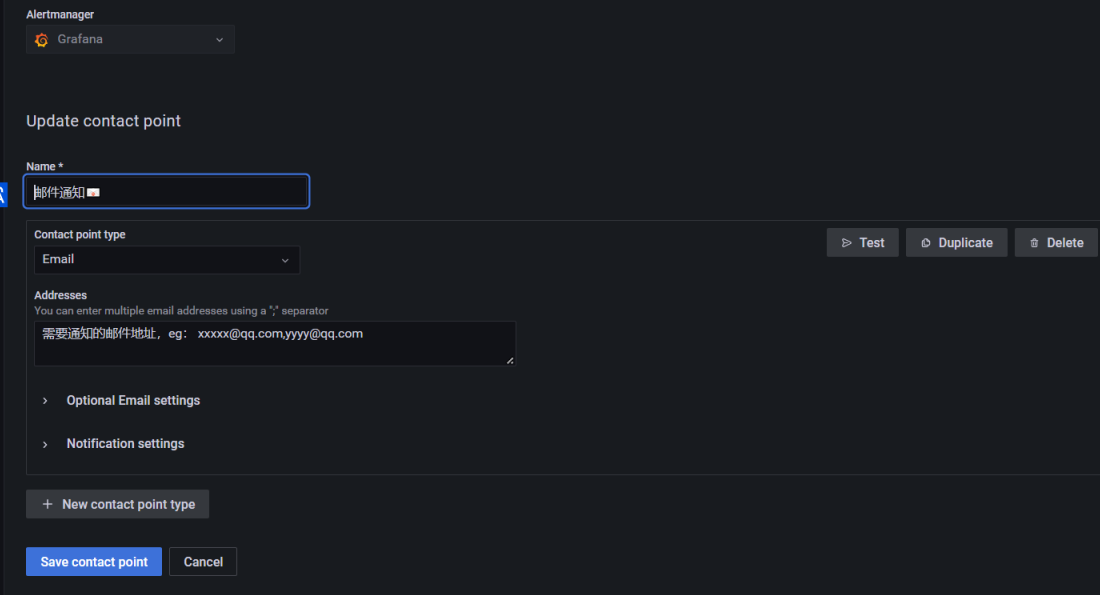
配置Contact points
新建一个new Contact points:
点击Test进行邮件测试:
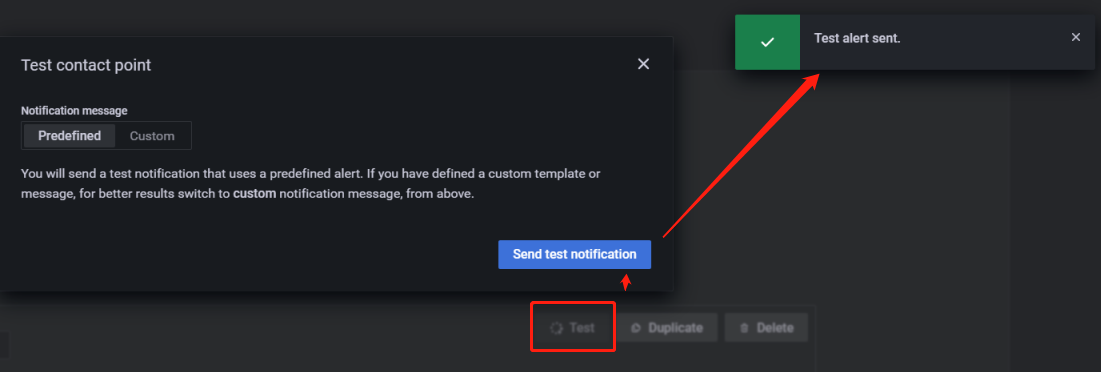
邮箱中收到:
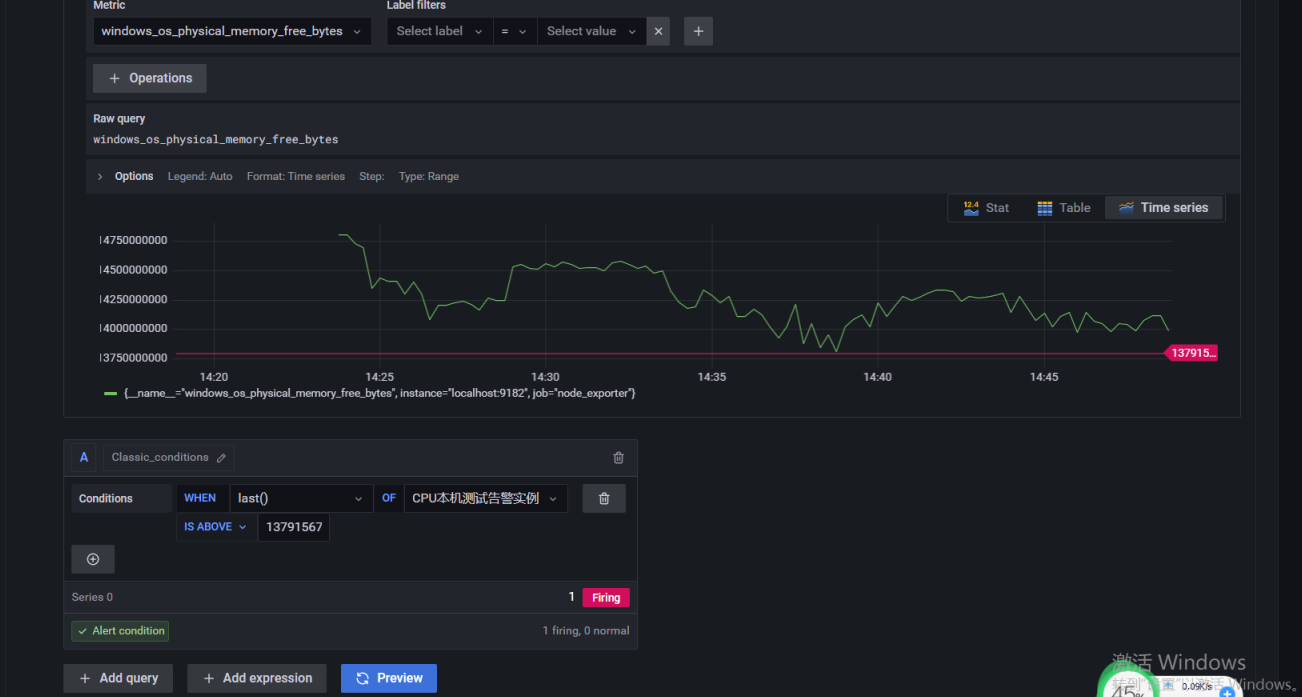
给对应的panel设置alert rule告警规则:
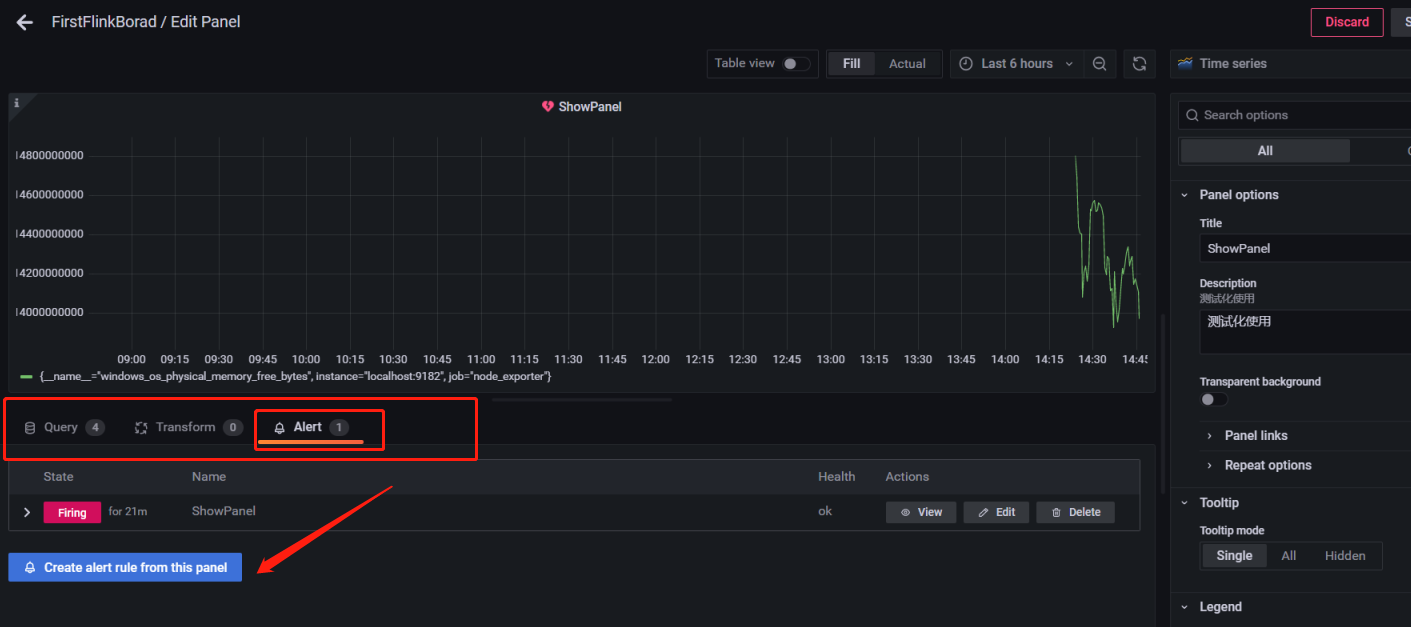
分为四步骤:一、针对query查询条件进行告警规则配置:
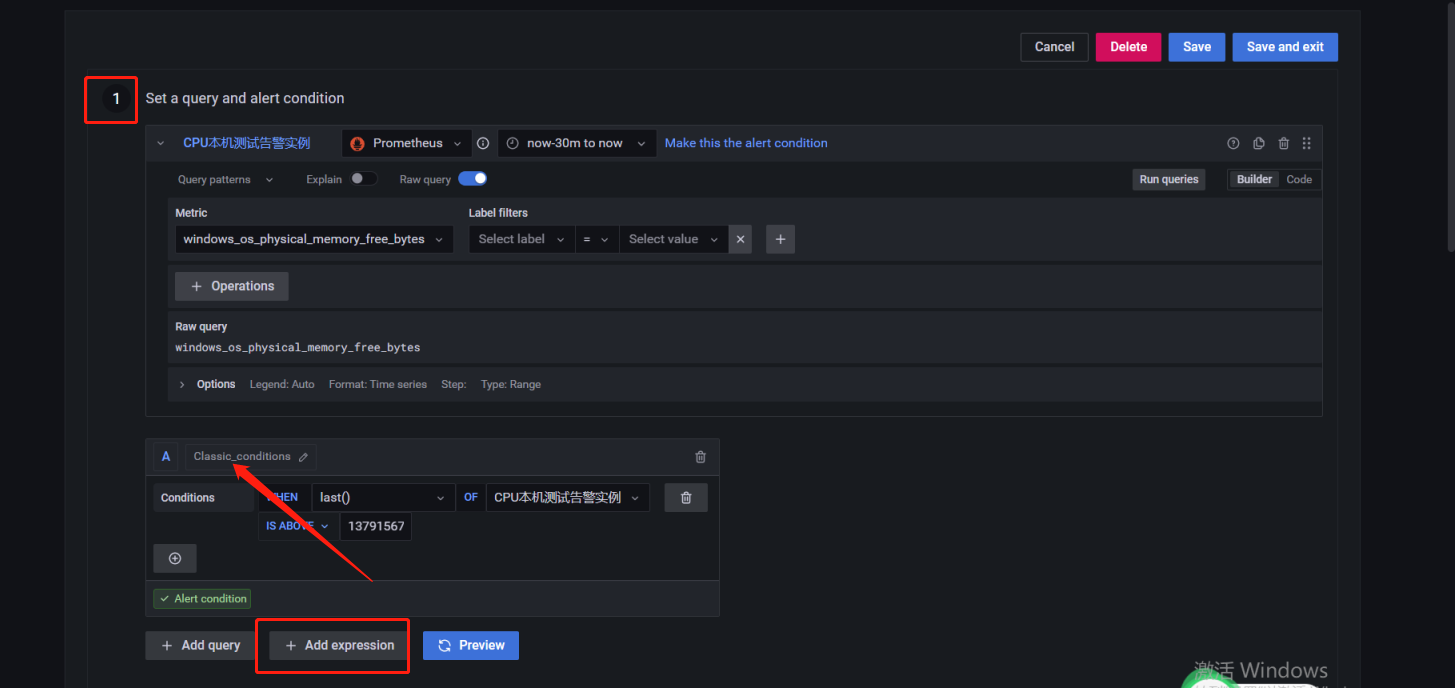
比如这里针对CPU本机测试告警实例的数据进行 一个固定值的阈值,当超过 IS ABOVE的时候进行告警:
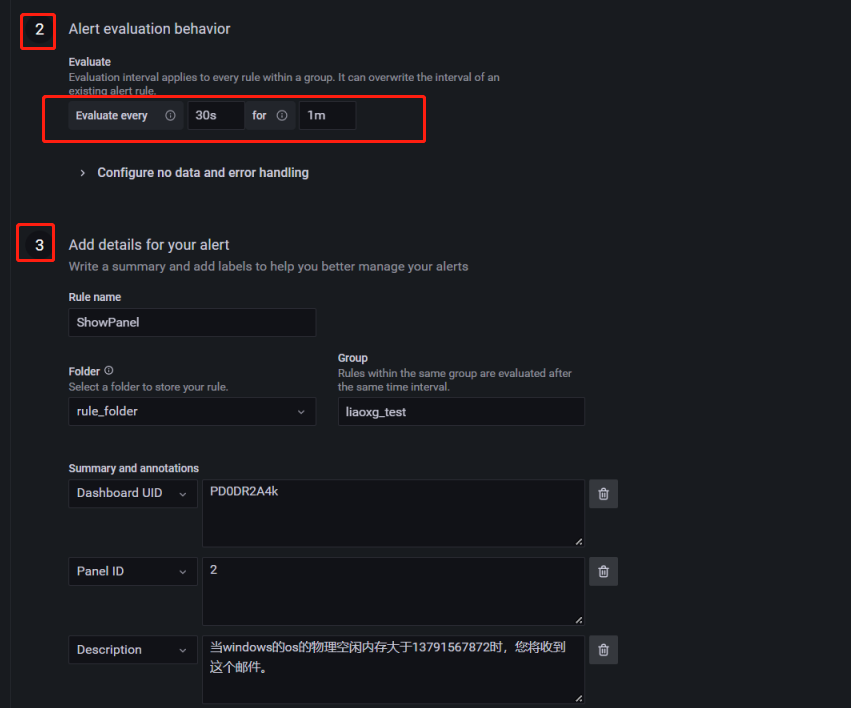
二、配置扫描时间和存在告警策略: 如下,每30秒扫描一次,如果存在告警问题延迟1分钟进行告警;
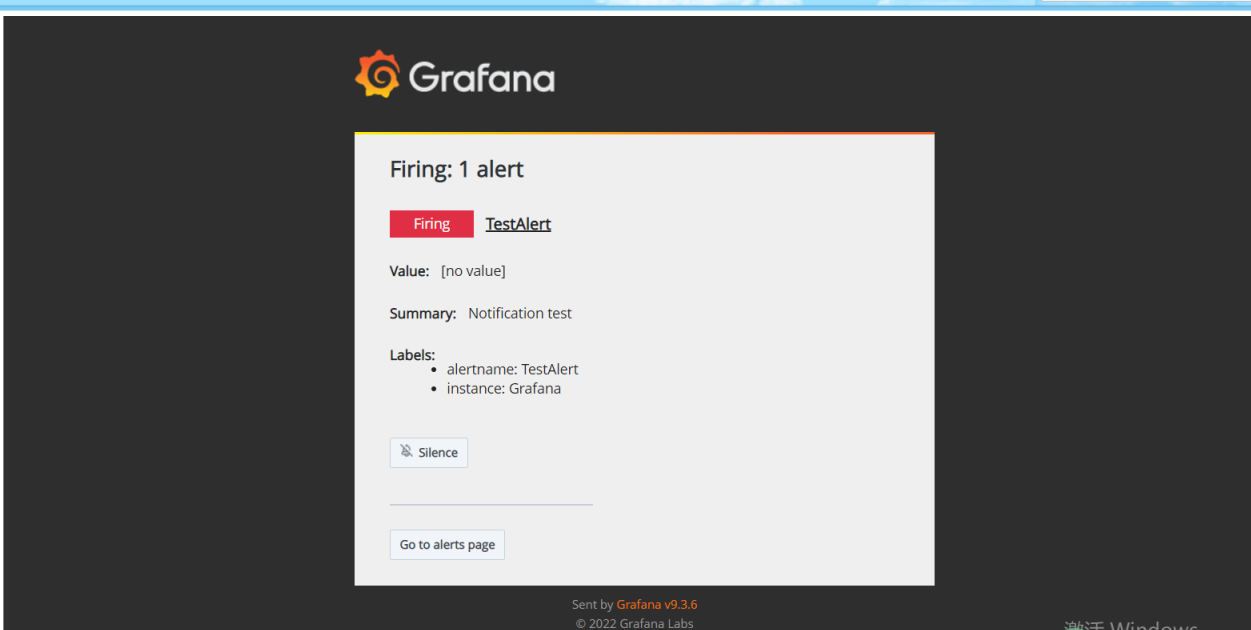
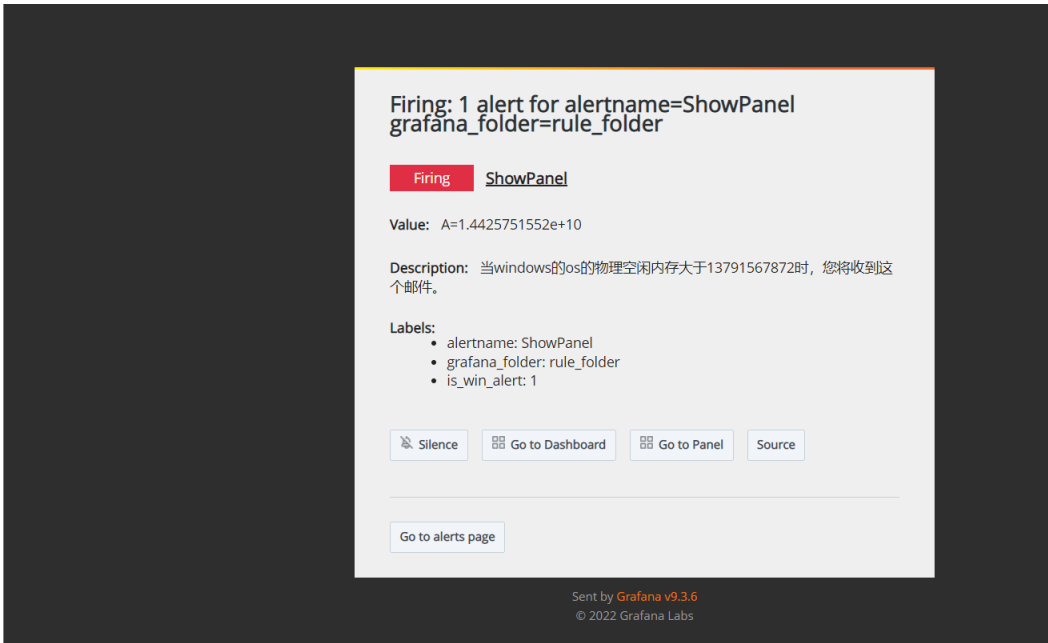
三、告警信息内容;
收到的内容是:
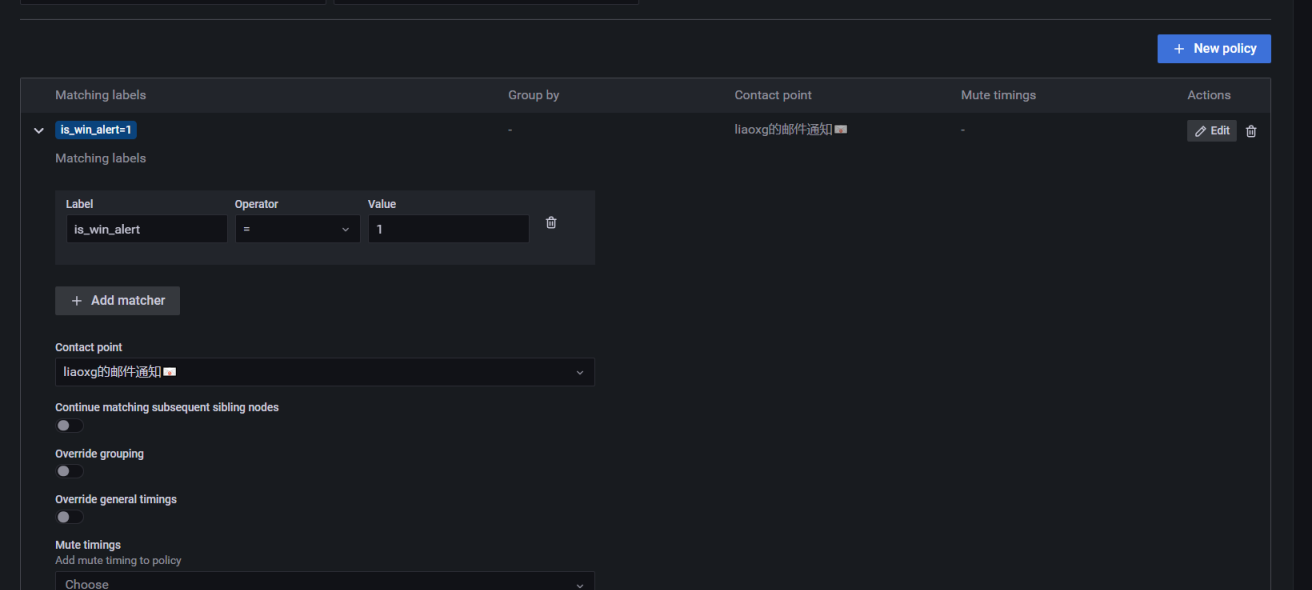
四、Notifications 关联,即关联 alert rule和 之前配置的 contact points, 通过 notification policy来关联:

因为Alert Rule是通过label来匹配Contact point。所以需要定义一个Notification policy,给Contact point定义label
Grafana的所有Alert Rule报警都会发送给Root policy,但是Root policy的Contact point是无法接收邮件的。所以需要修改Root policy的Contact point
如果Specific routing和Root policy是同一个Contact point,则只会收到一封报警邮件,而不是两封
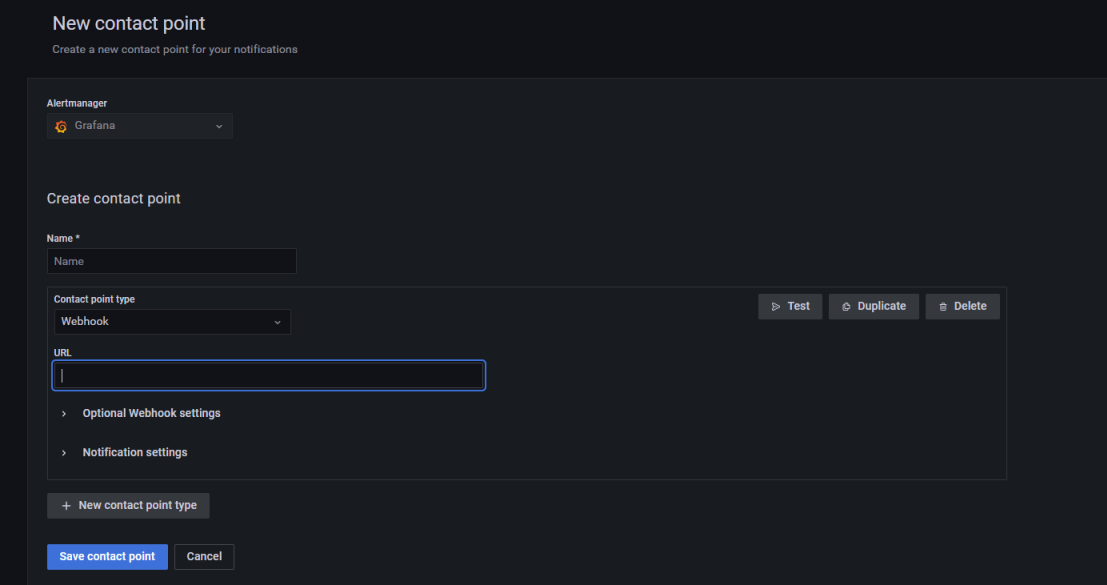
短信接口:可以选择contact point的类型为webhook:
指标的内容
Grafana的监控指标来源于Flink官方提供的指标:
https://nightlies.apache.org/flink/flink-docs-release-1.16/docs/ops/metrics/#system-metrics
Flink提供了四种类型的指标: Counter、Gauge、Histogram、Meter;
即:计数、Gauge瞬时值 、 Meter 平均值、Histogram 直方图。
可参考blog:一口气搞懂Flink Metrics监控指标和性能优化,全靠这33张图和7千字
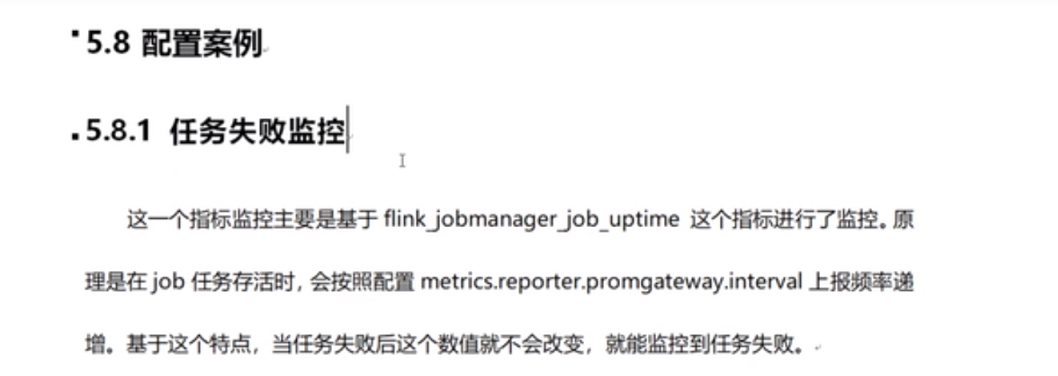
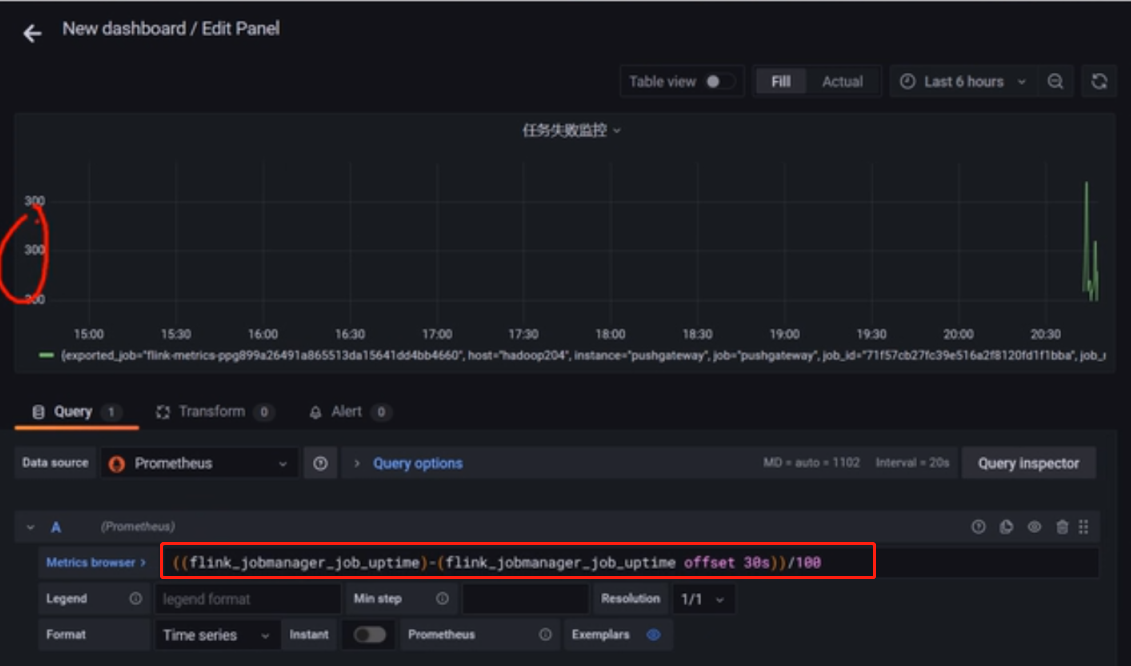
监控举例

自定义指标
Flink metrics的官网文档链接
外部关系存储
好像支持PostgreSql
使用
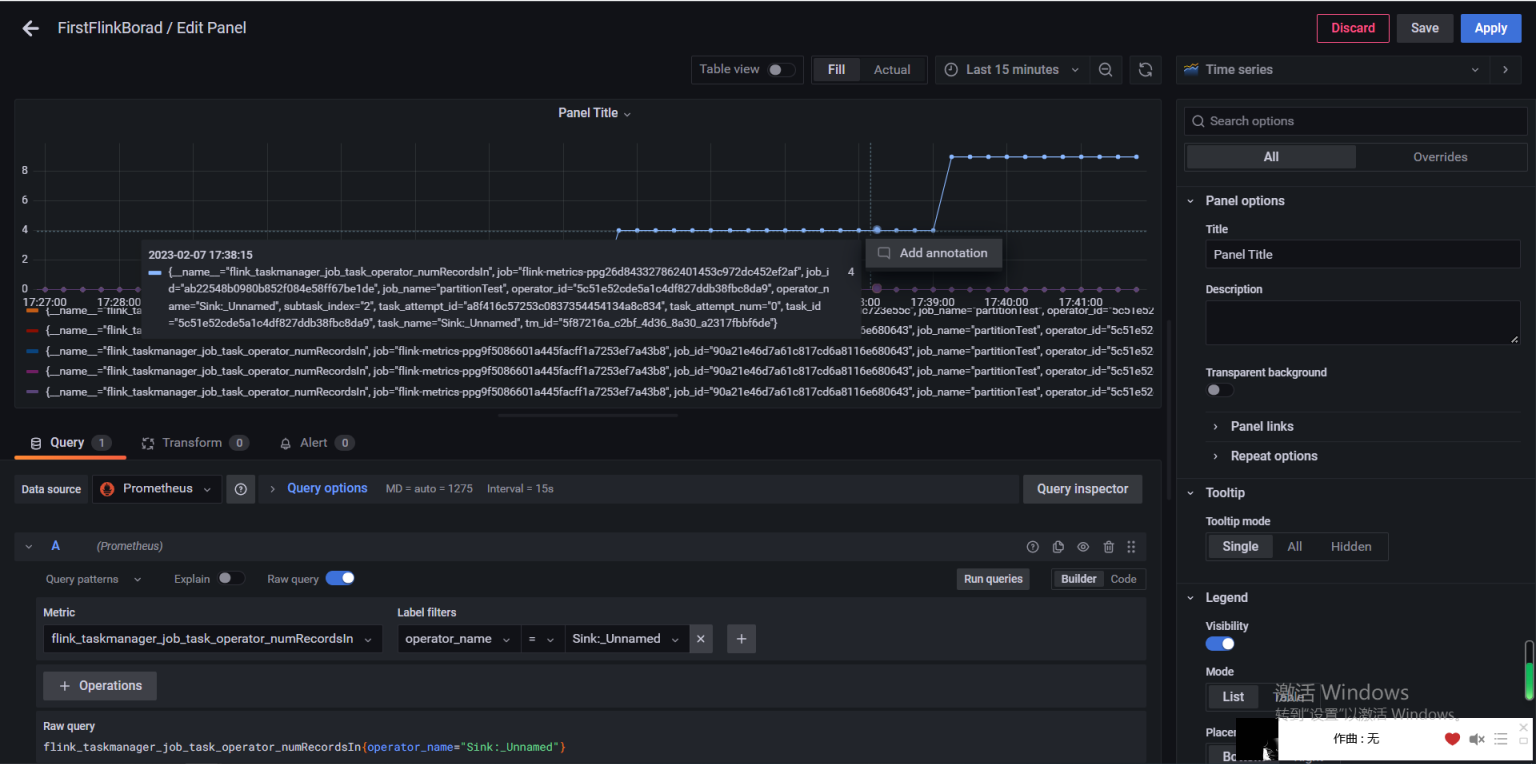
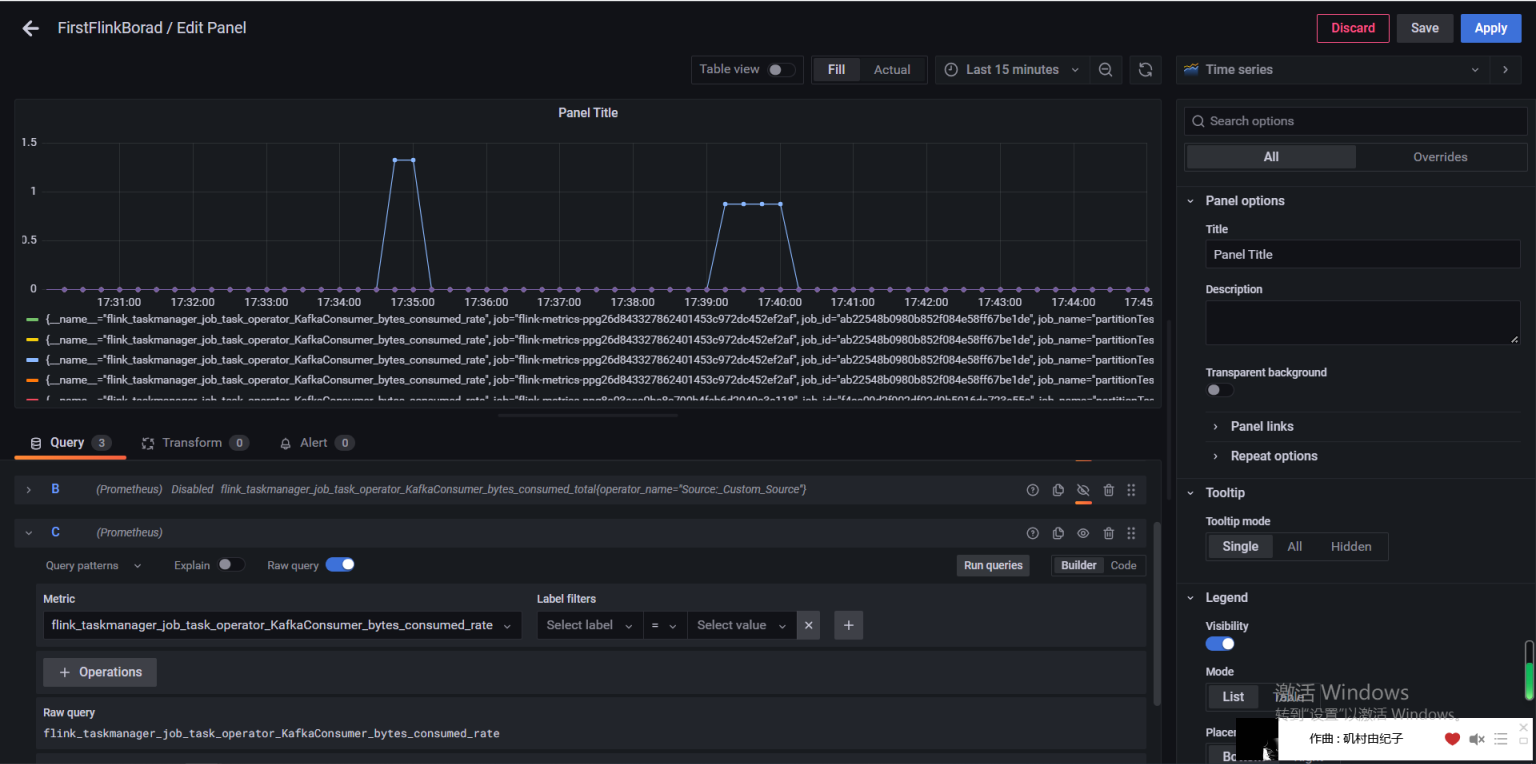
对应的:

flink_taskmanager_job_task_numRecordsIn
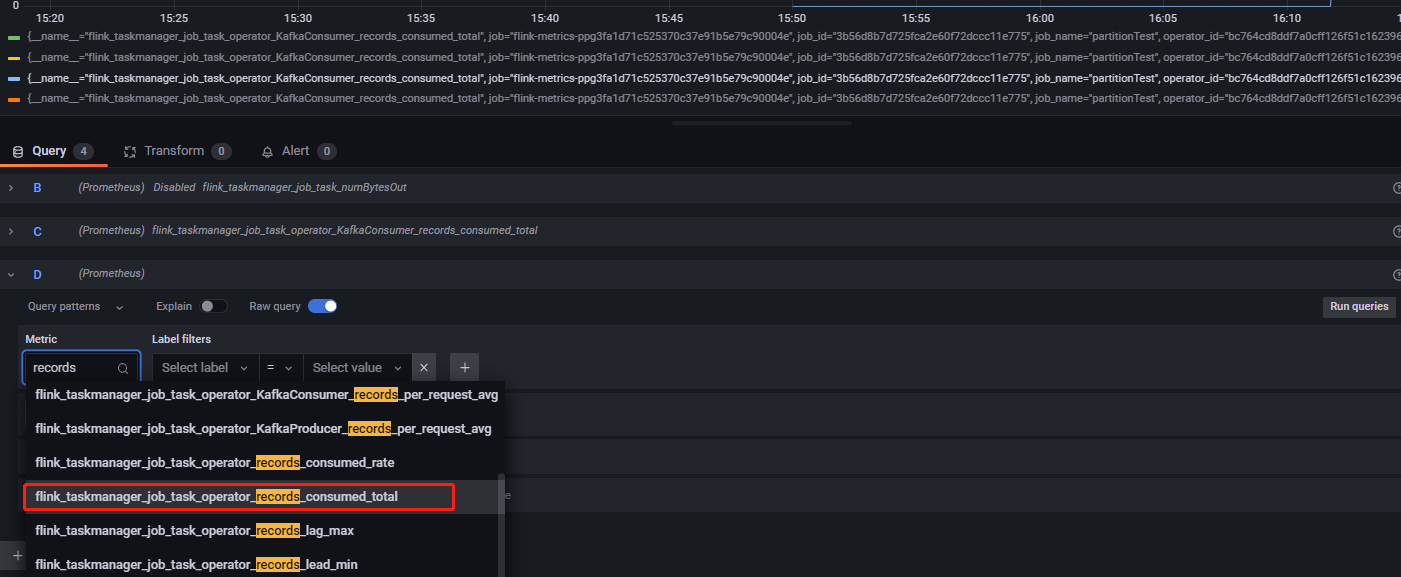
flink_taskmanager_job_task_records_consumed_total / rate
筛选条件:operator_name = Source:_Custom_Source 即可(下拉选项)